- 6. Equities - The Spanish market loses its European leadership
- 7. Equities – US equities leadership moved from FANGs (Facebook, Apple, Netflix, Google Alphabet) to Financials
- 8. Fixed Income – Income: Treasuries vs. US equities
- 9. Commodities - Energy on fire!
- 10. Equities - High hopes for small cap stocks


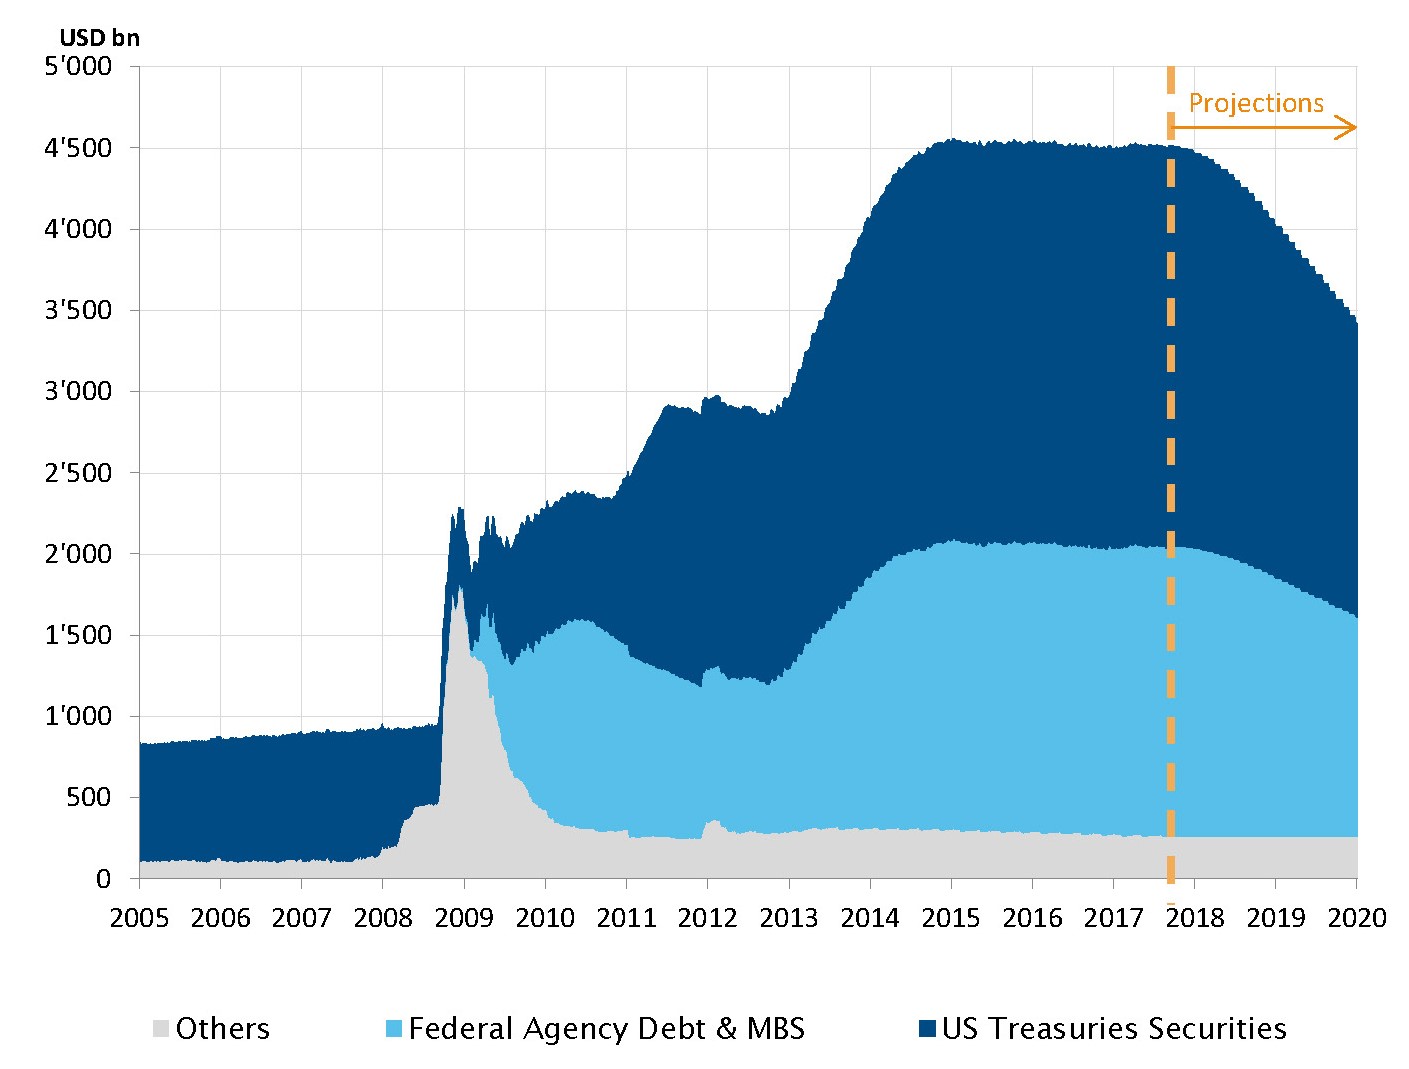
US - The Fed announces the beginning of balance sheet reduction
After initiating rate hikes two years ago, the Federal Reserve reached a new milestone in monetary policy normalisation process this month. It announced the beginning of its balance sheet unwinding, effectively reversing the three quantitative easing programmes implemented between 2009 and 2014. The process should reduce the size of the Fed balance sheet from the $4500bn level maintained since 2015 through the reinvestment of coupons and maturing bonds. Starting in October, the Fed will not sell assets directly on the market but will gradually decrease the pace of reinvestments in its US Treasury and mortgage-backed security holdings. The impact this process will have on the bond markets is not obvious. It is worth bearing in mind that interest rates actually rose during the initial phase of the three QE programs. In any case, this announcement will allow Ms Yellen to claim success in initiating the normalisation of her predecessor's unprecedented monetary policies.
The reduction of the Fed's balance sheet begins in October
Source: Federal Reserve. Bloomberg, SYZ Asset Management. Data as of: 30 September 2017
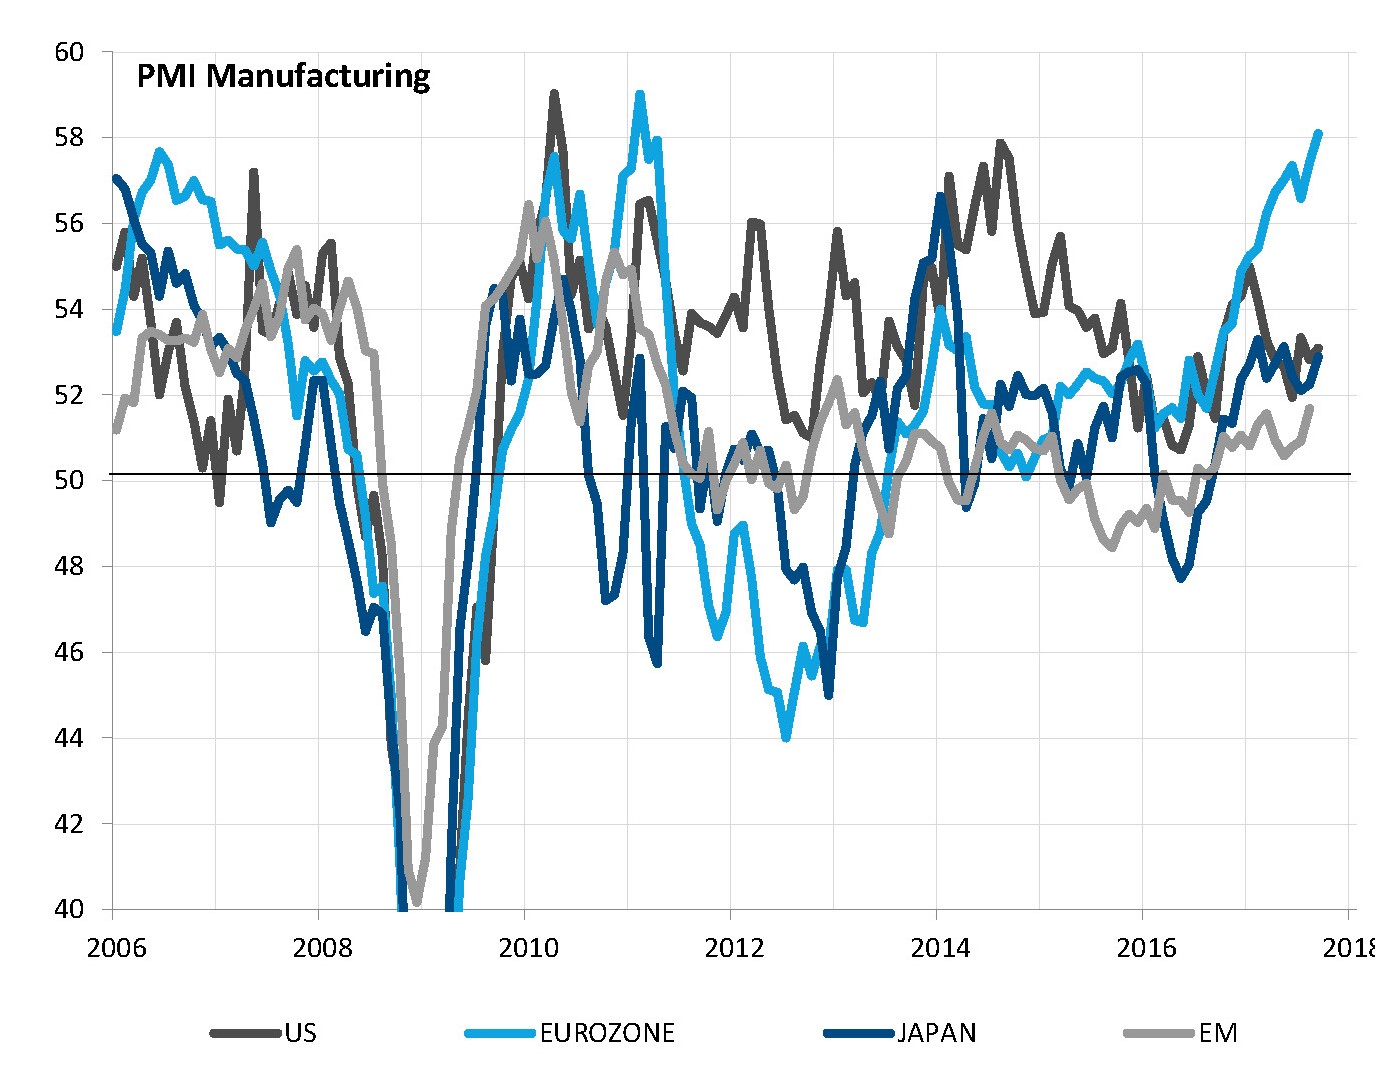
Cyclical indicators all point to global expansion, with Europe standing out
Source: Markit, Factset, SYZ Asset Management. Data as of: 30 September 2017
Eurozone - Leading the broad-based global expansion
The positive global growth landscape witnessed in the past 12 months remains firmly anchored, with activity indices showing expansion across all major developed and emerging economies. Global GDP is on track to experience its fastest growth rate in five years.
In this context, the Eurozone continues to stand out, spurred by the combination of surging domestic demand, helped by full monetary policy support, and external demand, in the context of positive global growth. Several confidence and activity indices hit new multi-year highs in September and concerns of a loss of growth momentum, possibly due to euro strength, have so far been proved wrong.
However, even if less spectacular, the US, Japanese and llarge emerging economies also exhibit firm growth momentum, as reflected by renewed upward trends in cyclical indicators such as PMI manufacturing, following a spring pullback. There are no clouds on the horizon from an economic growth point of view.
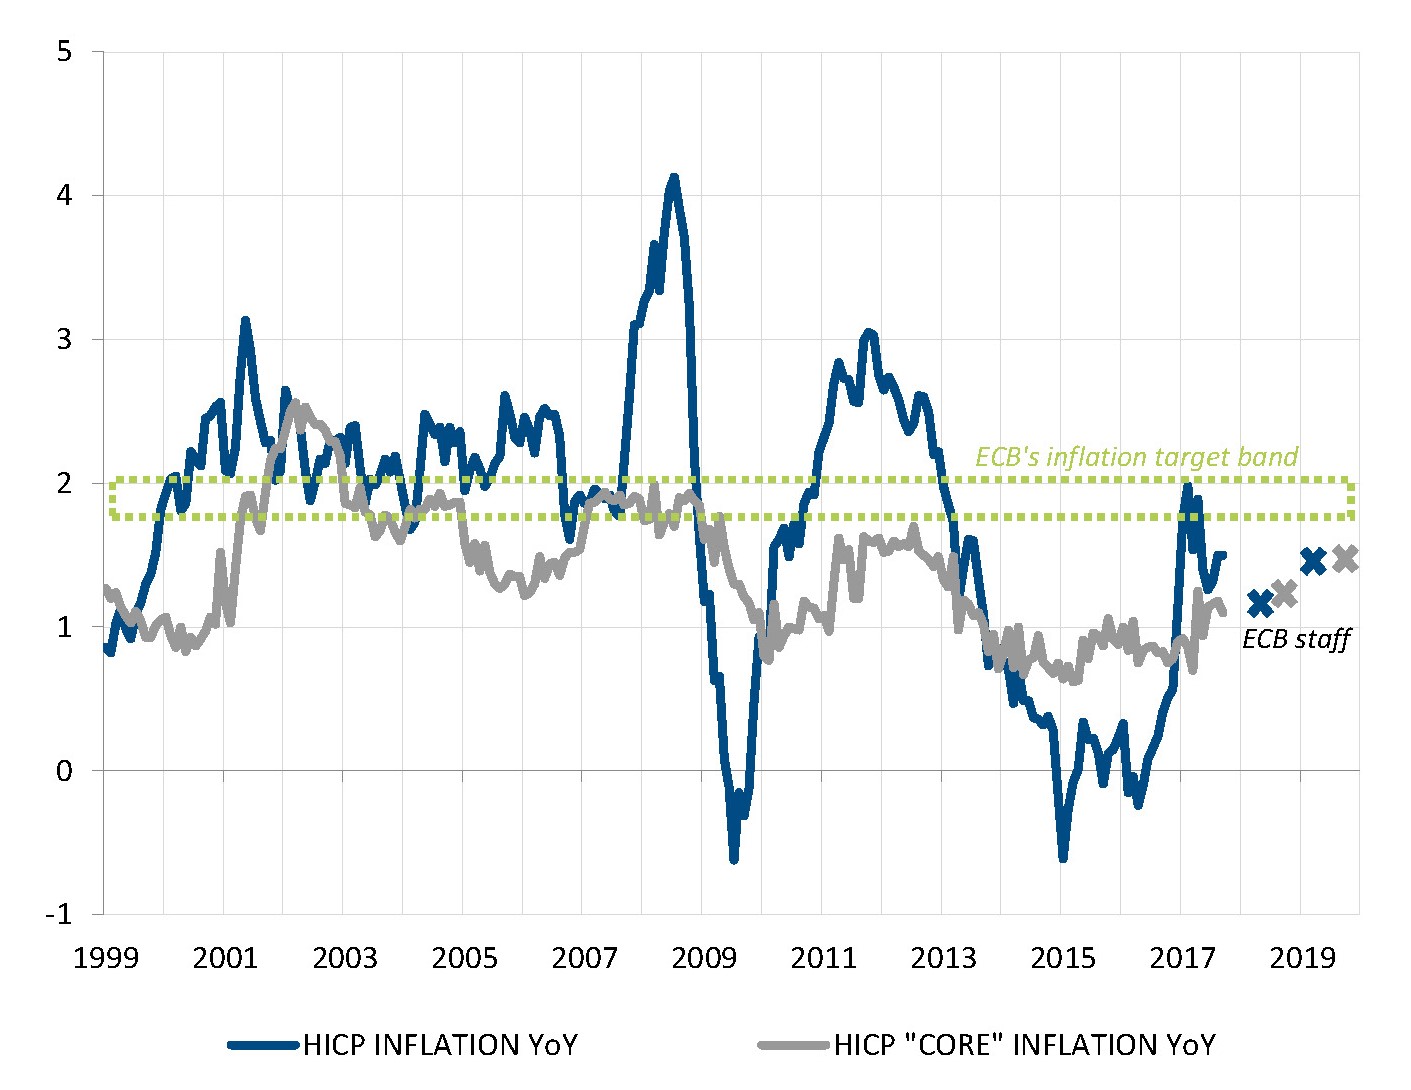
Eurozone - The missing inflation bit
There still one thing missing from the positive growth story before the picture is perfect from a central banker's point of view: inflation remains well below the target of the ECB and, more frustratingly, it is not expected to reach that target anytime soon.
In September, the ECB revised its GDP growth forecast up to acknowledge the strong economic dynamic but it also had to revise its inflation forecast down, due to the disinflationary impact of the recent euro strengthening. According to those forecasts, inflation will barely reach 1.5% by 2019, below the lower end of the 1.7%/2% range targeted by the central bank.
Mario Draghi and his peers are walking a thin line: it makes perfect sense to reduce QE purchasing if one considers that it is "recalibrating" in order to keep monetary policy support unchanged in the face of improving macro conditions. But in no way does it warrant monetary policy tightening "Fed style", given the subdued inflation outlook.
Inflation remains far below target and will hardly go up
Source: ECB, Factset, SYZ Asset Management. Data as of: 30 September 2017
The Bank of England may hike rates before the year end
Source: Bloomberg, SYZ Asset Management. Data as of: 30 September 2017
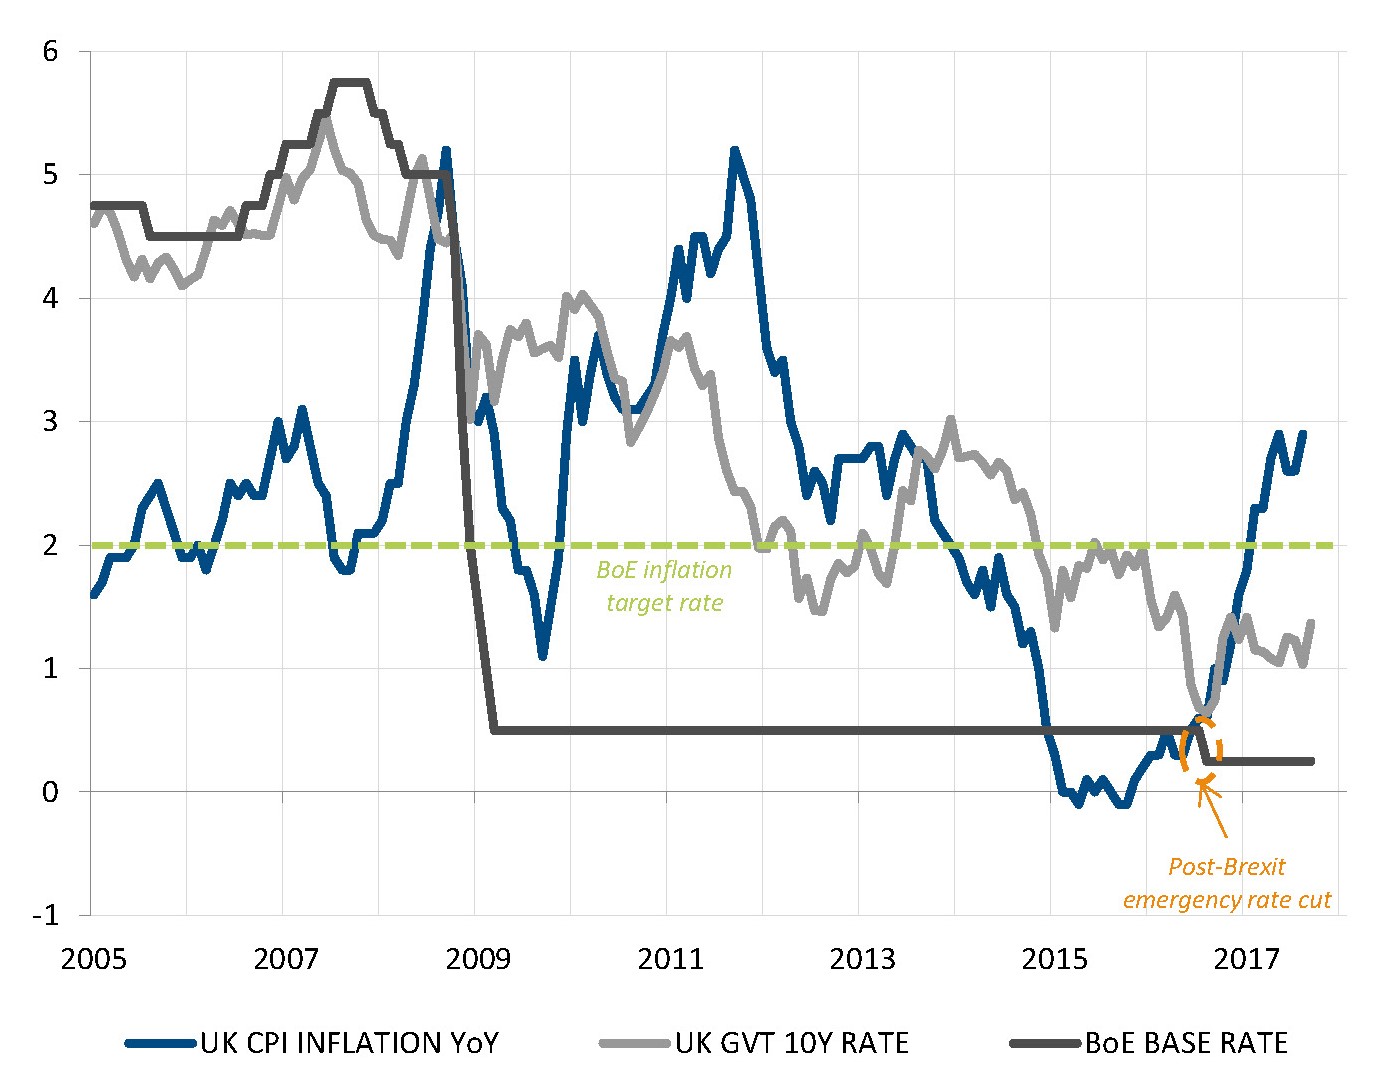
United Kingdom - A rate hike before year end?
If there is one place in the developed world where inflation can surprise on the upside, it must be the United Kingdom. While inflation remains desperately low in the US and the Eurozone (not to mention Japan), it has neared 3% in the UK since last spring.
While part of it is surely to do with sterling weakness and so-called "imported inflation", it nevertheless exerts pressure on the central bank to act, especially given unexpected post-Brexit GDP growth resilience. With hindsight, the August 2016 25bps rate cut appears quite unwarranted and, based on the latest comments from committee members, the likelihood that this may be reversed with a 25bps hike by the end of the year is now quite high (70% according to Bloomberg).
Fixed Income - Portugal recovers its Investment Grade rating
Is the convergence trade over in Europe? Not really as with a favourable growth backdrop, dissipation of Eurozone breakup risk and country-specific recovery, Portugal has witnessed a significant improvement in its credit risk in 2017. The upgrade in mid-September of its S&P sovereign rating back into Investment Grade came as the cherry on the cake.
Better economic fundamentals for Portugal had already been acknowledged by fixed income markets since the spring, with a sharp compression of Portuguese sovereign spreads. The S&P sovereign rating upgrade on September 15, from BB+ to BBB-, opened up access to Portuguese sovereign bonds for IG-constrained fixed income investors, with subsequent additional spread compression. Portuguese 10-year government bonds are now yielding only 30bps more than Italian government bonds.
This example highlights the ongoing recovery of previously "peripheral-countries" having been engaged in IMF/EU programs. Ireland is the poster-child of this group, with currently tighter spreads to Germany than France. And if the Greek case remains full of uncertainty, Cyprus might well be the next one to recover its IG rating. S&P assigned a "positive outlook" to its sovereign BB+ rating on the same day it raised Portugal's rating to BBB.
Portugal is back in the investment grade club in 2017
Source: Bloomberg, SYZ Asset Management. Data as of: 30 September 2017
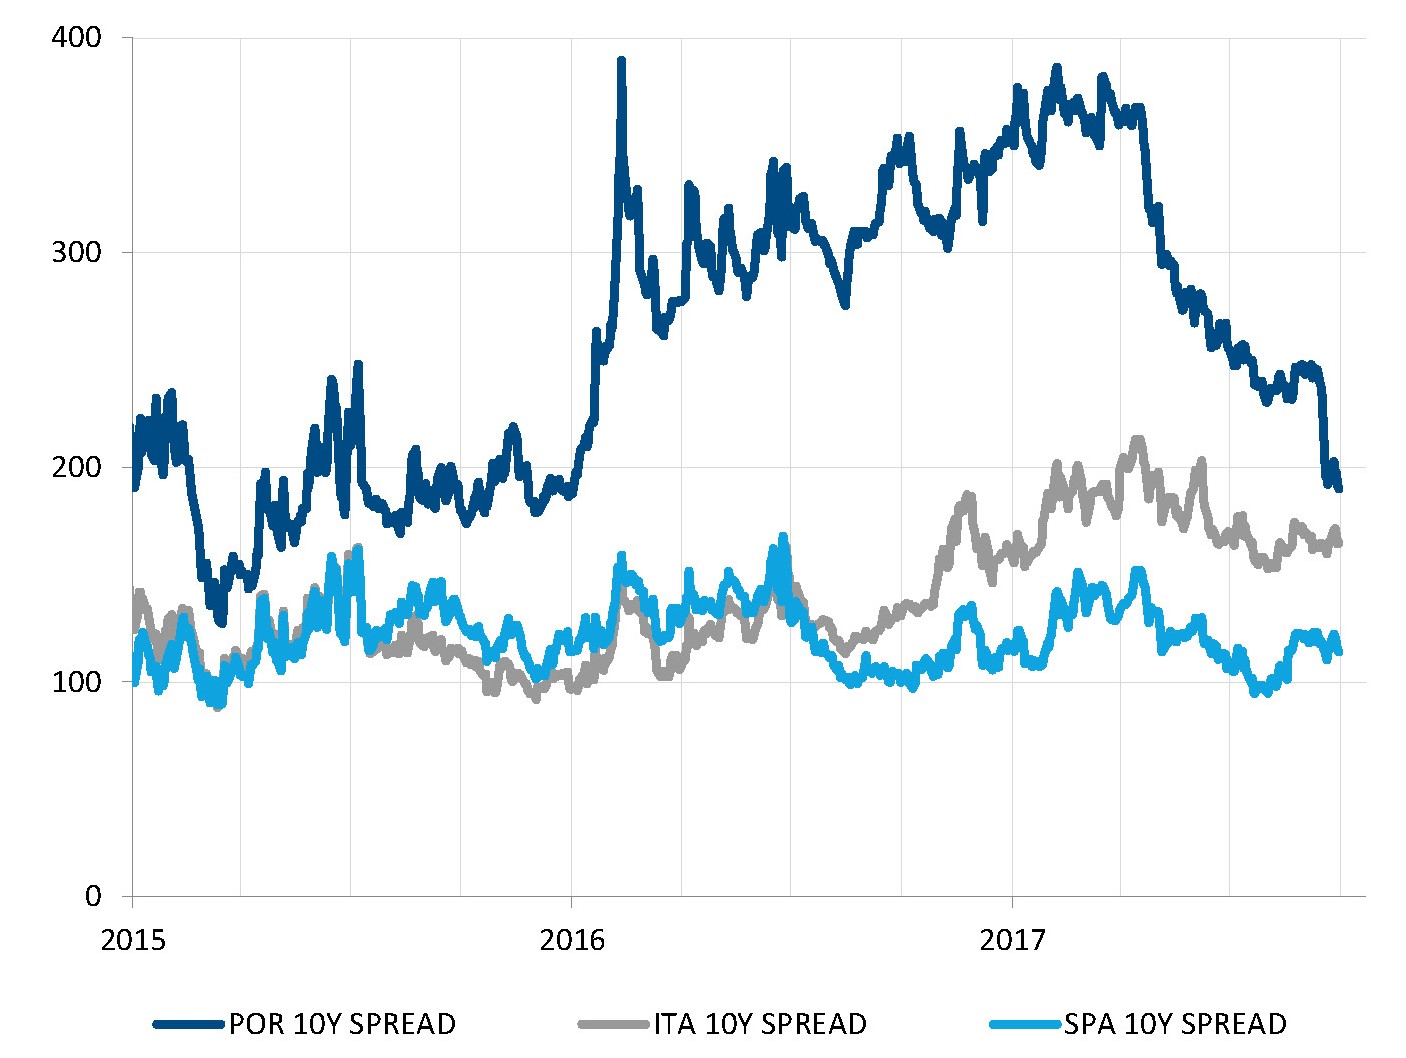
Spanish equities have lost their lead in European markets
Source: Bloomberg, SYZ Asset Management. Data as of: 30 September 2017
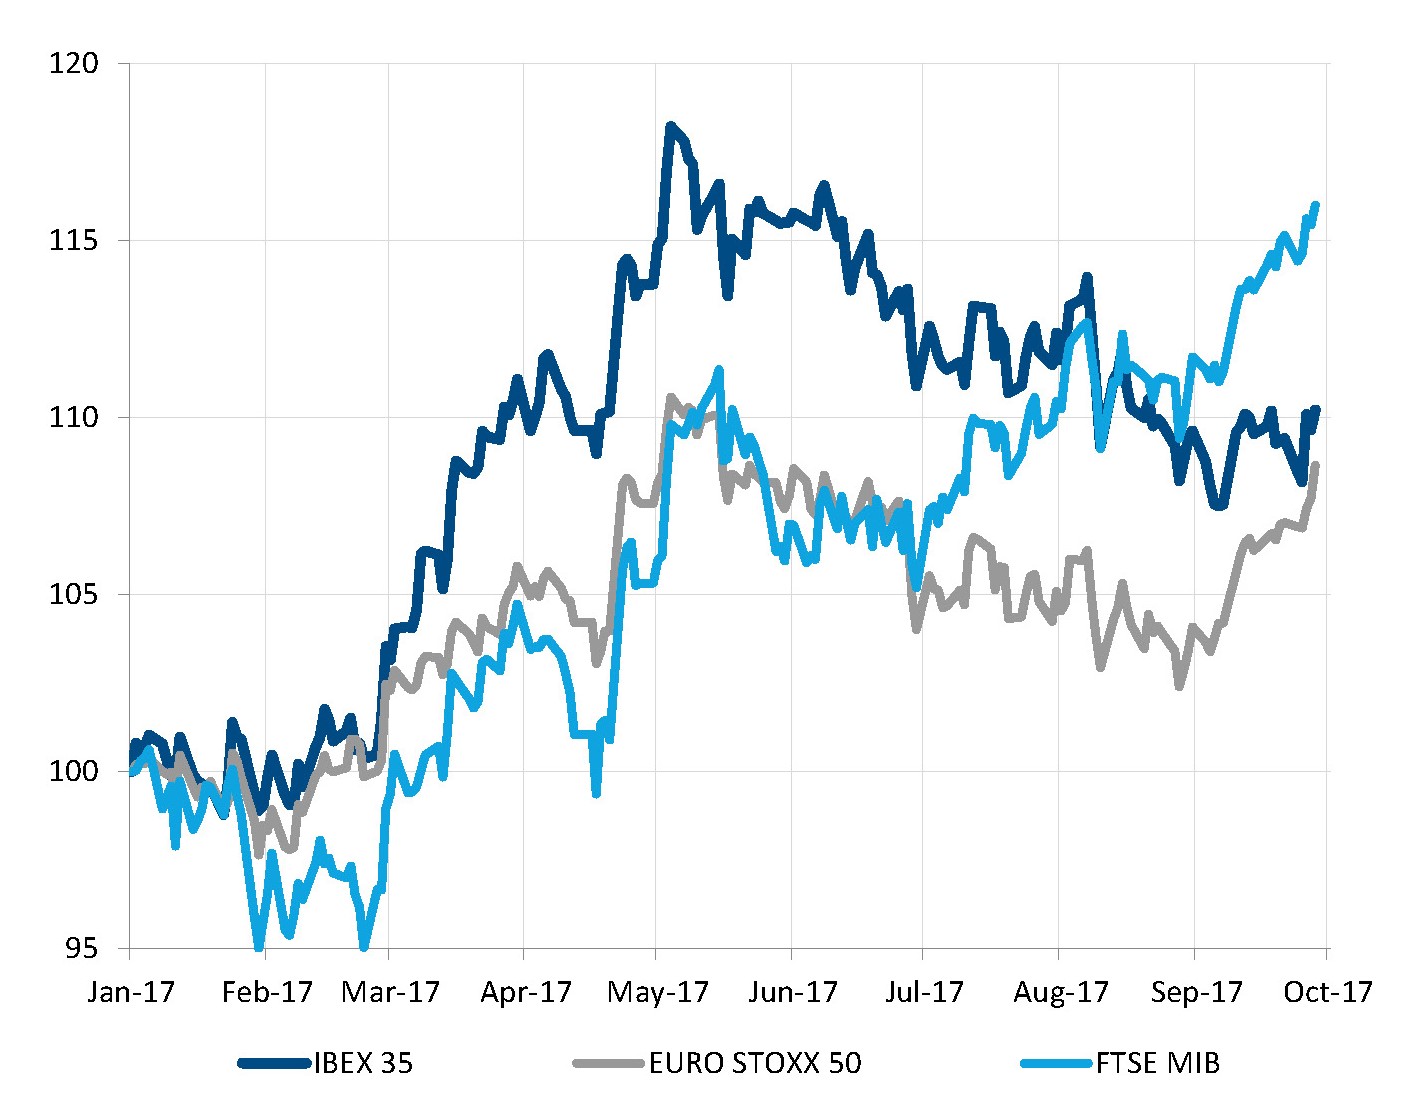
Equities - The Spanish market loses its European leadership
Spain has been the most dynamic of the large European economies in the past three years. Freed pent-up demand after harsh fiscal austerity, helped by declining unemployment, has fuelled a 3% GDP annual growth rate since 2015.
Such favourable growth backdrop helped the Spanish equity market to outperform other European markets until the summer, with at one point a year-to-date performance about twice that of the Eurostoxx 50.
However, this outperformance has vanished as the IBEX hasn't experienced the September rally recorded by the DAX (+6.4%), the CAC40 (+4.8%) or the FTSE MIB (+4.7%), the latter extending a positive trend that appeared in July. The Spanish index was up only 0.8% over the month, penalised by uncertainties around the "referendum" in Catalonia on October 1st, and rising tensions between Catalonia's regional government and Spain's central government in Madrid.
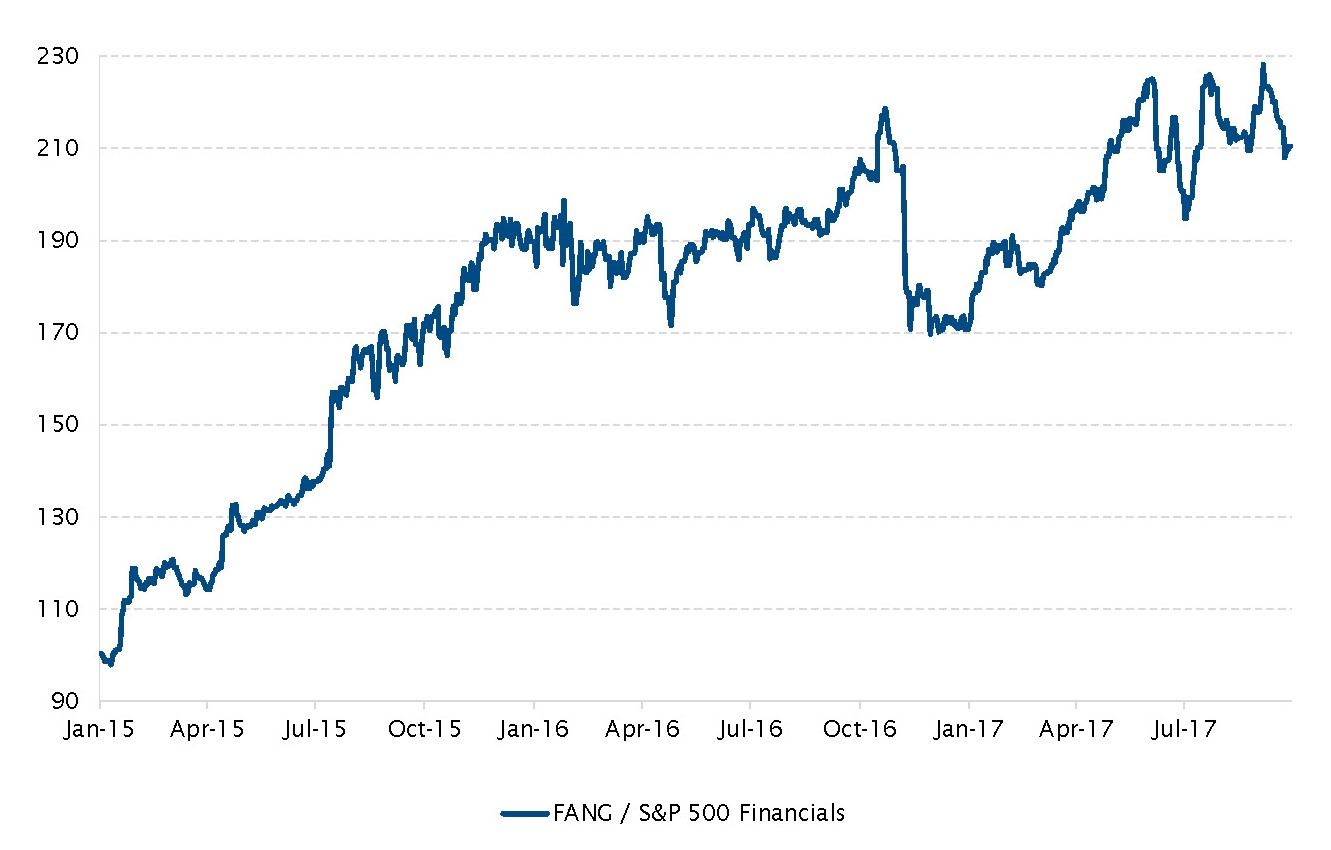
Equities – US equities leadership moved from FANGs (Facebook, Apple, Netflix, Google Alphabet) to Financials
The month of September brought some changes to some equity market trends that dominated most of the year so far.
One major new trend was US banks (and small caps) outperforming the broader index but also the FANGs in September. Moreover, within the developed equity world, value stocks (financials for example) also outpaced growth stocks (FANGs for example).
This movement was helped by the dollar stabilising (dollar index +0.4%) and global rates moving higher (US Treasury yield +21 bps), coupled with the more hawkish than expected Fed.
At the same time in the US, the economic backdrop remained favourable. But inflation now probably bottoming out, Trump’s (reduced) promises back on the table and Janet Yellen signalling the Fed’s intention to go ahead with monetary policy “normalisation” all made reflation trades resurface on the markets last month.
In this context, financials ended the month up 5.1%, well above the S&P 500 index closing the month up 1.9% and also beating the Information Technology sector that closed September up 0.6%.
Relative performance of FANGs vs. S&P 500 financials
Source: Bloomberg, SYZ Asset Management. Data as of: 30 September 2017
US Treasury 10y yield and S&P 500 estimated dividend yield (12 month forward)
Source: Bloomberg, SYZ Asset Management. Data as of: 30 September 2017
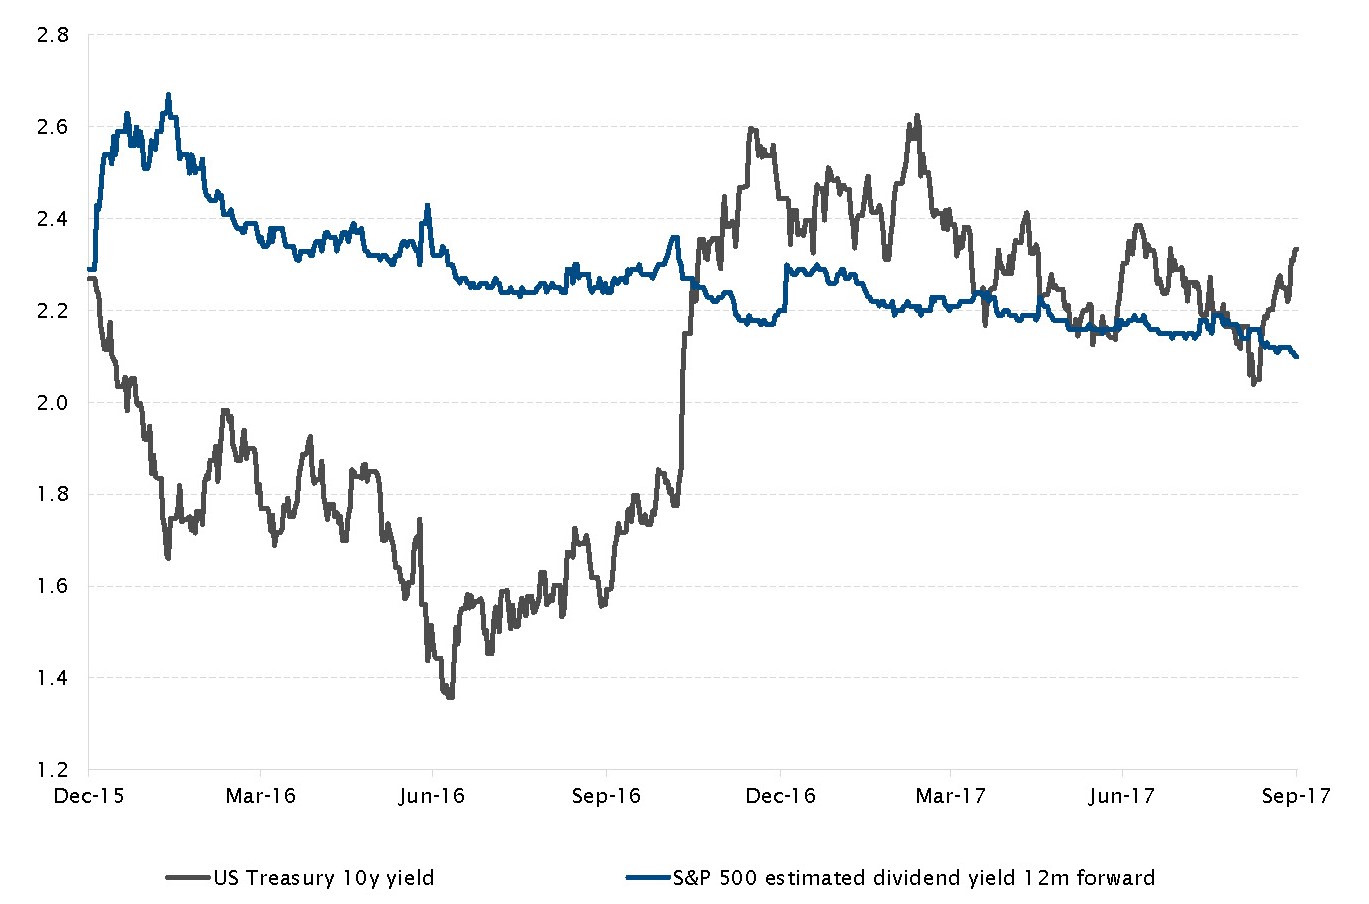
Fixed Income – Income: Treasuries vs. US equities
Since the end of June, when global interest rates temporarily surged, rates turned to the downside after the Fed turned less hawkish than anticipated coupled with the release of less-strong activity data. Gradually, market-based expectations of monetary policy in the US and Europe changed. While both the ECB and the Fed are increasingly hinting to a normalisation of their monetary policy, the probability of a rate hike in the US in the near future has fluctuated before finishing the month at around 70% (for a December hike based on the Fed funds future) following the Fed meeting.
In this context, until the middle of the month, the yield on the 10 year US Treasury was abnormally lower than the 12 month forward estimated dividend yield of the US equity market (S&P 500).
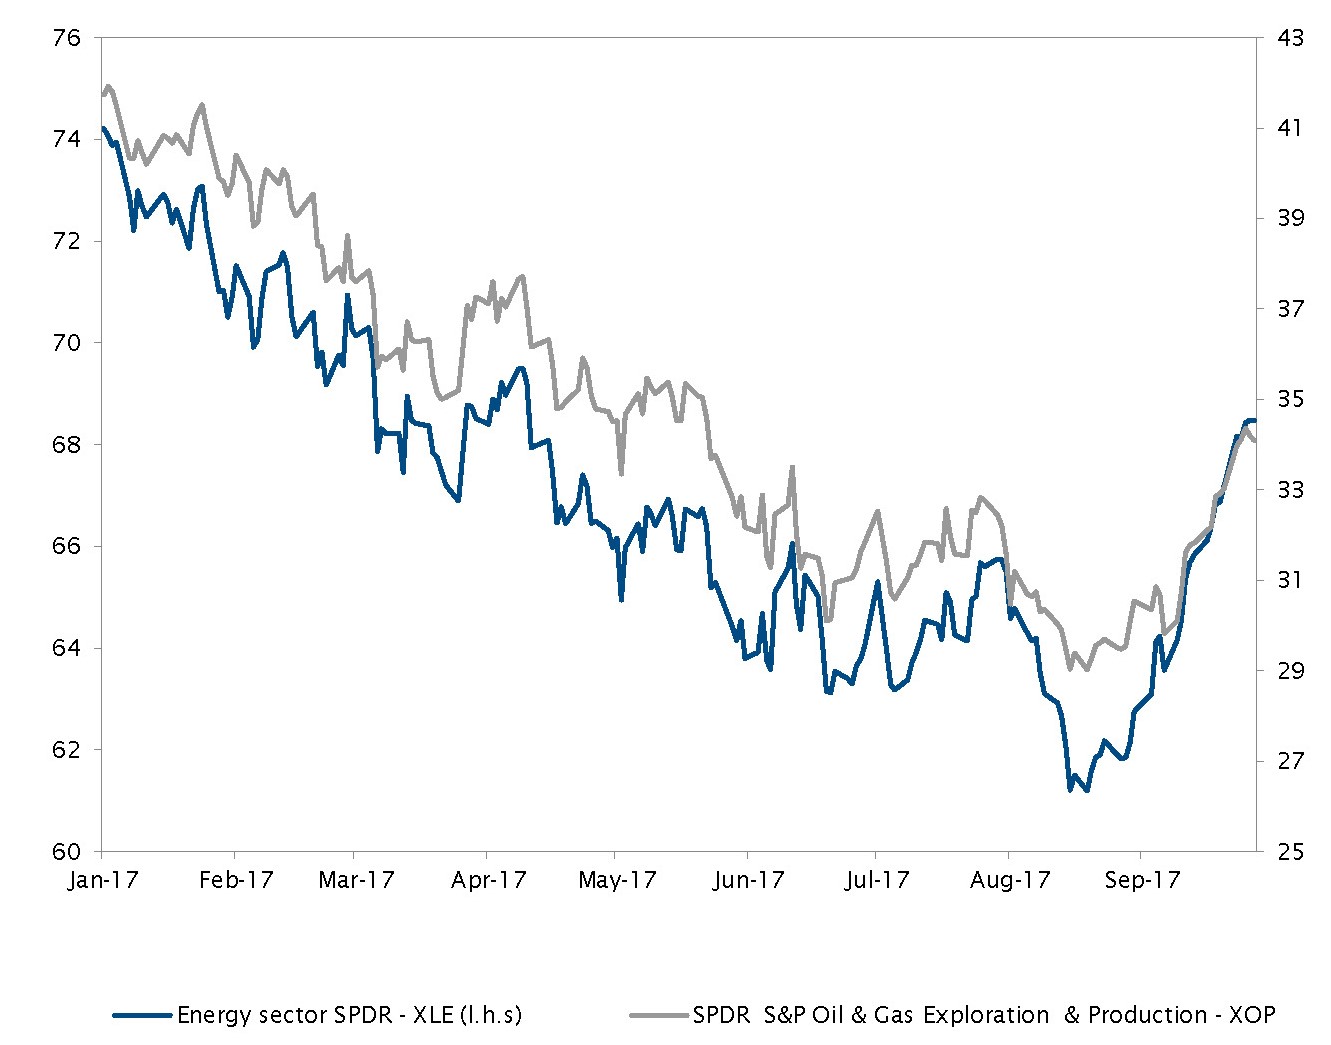
Commodities - Energy on fire!
Energy stocks have been a drag on investors’ portfolios throughout the year but September proved to be rewarding to those who kept their positions. XLE, the main tracker of energy companies was up 10%, while the XOP, the ETF tracking Exploration & Production companies, increased by more than 13%. After this more than welcomed rally, investors are now asking if the momentum can continue.
Investors could find a number of reasons to be positive. WTI has successfully broken the $50 mark and closed higher, while there seems to be not that much oversupply compared to the beginning of the year. Energy stocks are also under the radar of value investors as they trade at a generous discount. More interest from value players combined with a sustained momentum could transform into a virtuous circle for the sector. Finally, hopes of tax reform could have a positive impact for the sector.
The best monthly performance for the energy sector of the year
Source: Bloomberg, SYZ Asset Management. Data as of: 30 September 2017
Russell 2000 jumps to record high
Source: Bloomberg, SYZ Asset Management. Data as of: 30 September 2017
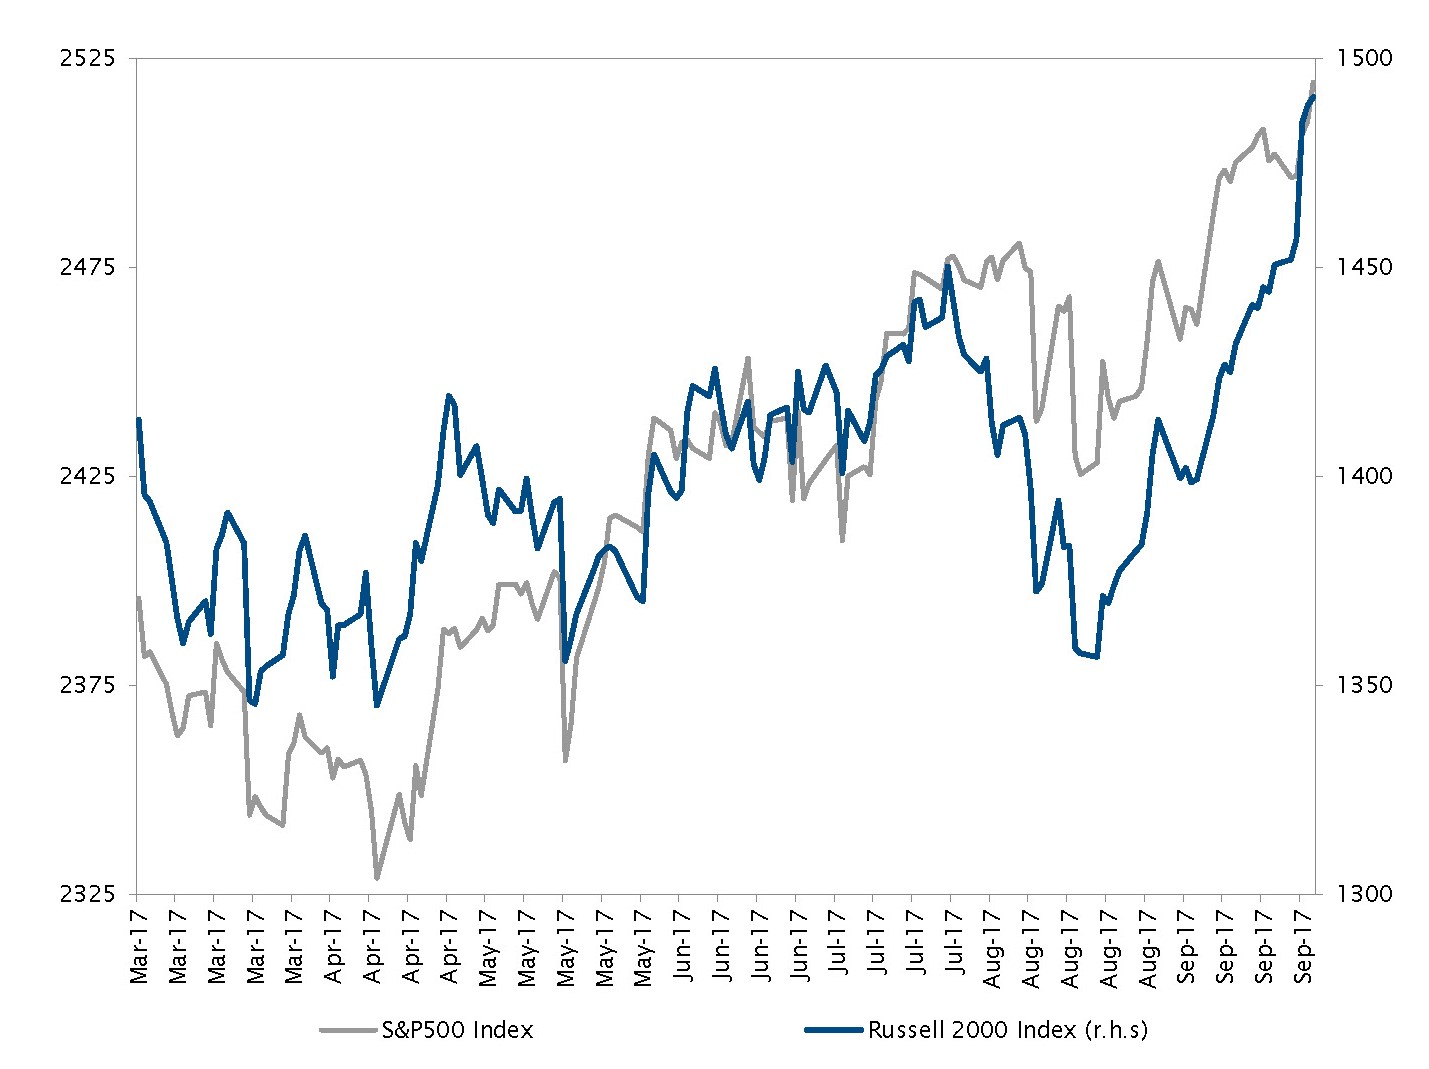
Equities - High hopes for small cap stocks
US small-cap stocks, which lagged the S&P500 since the beginning of the year, experienced a welcomed boost in September on the back of a potential tax reform plan.
The rationale for the boost comes from the median tax rate of the companies in the Russell 2000 versus companies in the S&P500. Russell 2000 companies have a median tax rate of 31%, their S&P 500 peers are paying 28%, while the mega cap names included in the Dow Jones enjoy a median tax rate of 23%. Under the current proposed plan, the corporate tax rate would come down to 20% from 35%, which was one of the arguments for investors to rush into small-cap companies.
However, investors must keep in mind that the Trump administration has a terrible hit ratio in passing reforms and there is no reason this one would be the exception.
Disclaimer
This marketing document has been issued by Bank Syz Ltd. It is not intended for distribution to, publication, provision or use by individuals or legal entities that are citizens of or reside in a state, country or jurisdiction in which applicable laws and regulations prohibit its distribution, publication, provision or use. It is not directed to any person or entity to whom it would be illegal to send such marketing material. This document is intended for informational purposes only and should not be construed as an offer, solicitation or recommendation for the subscription, purchase, sale or safekeeping of any security or financial instrument or for the engagement in any other transaction, as the provision of any investment advice or service, or as a contractual document. Nothing in this document constitutes an investment, legal, tax or accounting advice or a representation that any investment or strategy is suitable or appropriate for an investor's particular and individual circumstances, nor does it constitute a personalized investment advice for any investor. This document reflects the information, opinions and comments of Bank Syz Ltd. as of the date of its publication, which are subject to change without notice. The opinions and comments of the authors in this document reflect their current views and may not coincide with those of other Syz Group entities or third parties, which may have reached different conclusions. The market valuations, terms and calculations contained herein are estimates only. The information provided comes from sources deemed reliable, but Bank Syz Ltd. does not guarantee its completeness, accuracy, reliability and actuality. Past performance gives no indication of nor guarantees current or future results. Bank Syz Ltd. accepts no liability for any loss arising from the use of this document. (6)