- 1. US-China – Is a trade war really reasonable ?
- 2. US – Jerome Powell opens his mandate with an (expected) rate hike
- 3. US – Sky-high consumer sentiment contrasts with lacklustre consumption spending
- 4. Eurozone – From recovery to mid-cycle expansion
- 5. China – A stronger yuan as capital outflows cease


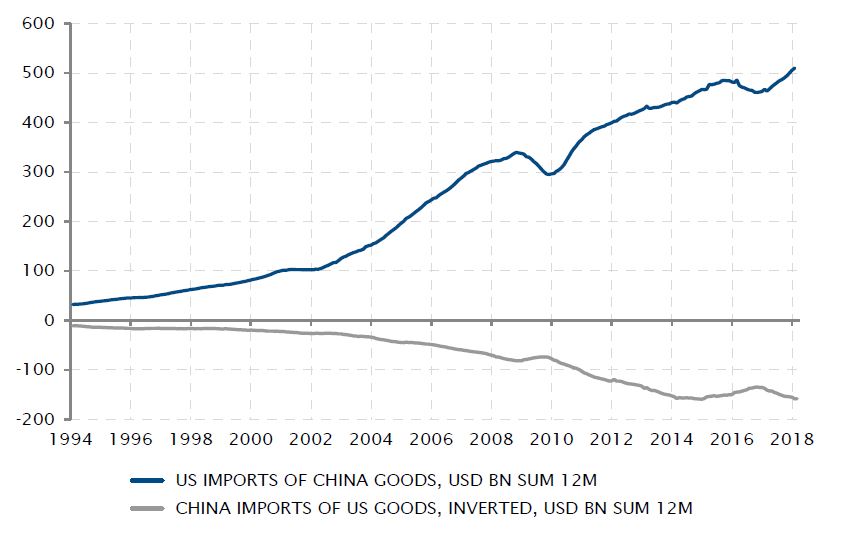
US-China – Is a trade war really reasonable ?
On the one hand, one can hardly blame Donald Trump for implementing his electoral campaign promises. On the other hand, his announcement of 25% tariffs on USD 60bn worth of Chinese imports could open a Pandora’s box…
After an extended period of sluggishness, global trade has just taken off again, as the global economy finally resumed a synchronised expansion in the last couple of years. In this context, the US imported close to USD 500bn of Chinese goods last year. Any import tariffs would have the immediate effect of raising prices for US businesses and consumers, hitting profits, margins and real consumption spending well before substitute production lines can possibly be built on US soil.
Moreover, such a decision will incur reciprocal measures from China, which not only imports about USD 150bn of US-made goods a year, but is also a huge end-market for US companies. At this stage, it is difficult to assess the magnitude of the threat and its potential implications, but it is also equally difficult to see anything really good coming out of a trade war for the global economy…
Fragile foundations for a trade war, from both standpoints
Sources : Bloomberg, SYZ Asset Management. Data as at : 31 March 2018
Investors (and the Fed) expect more rate hikes in 2018
Sources : Federal Reserve, Bloomberg, SYZ Asset Management. Data as at : 31 March 2018
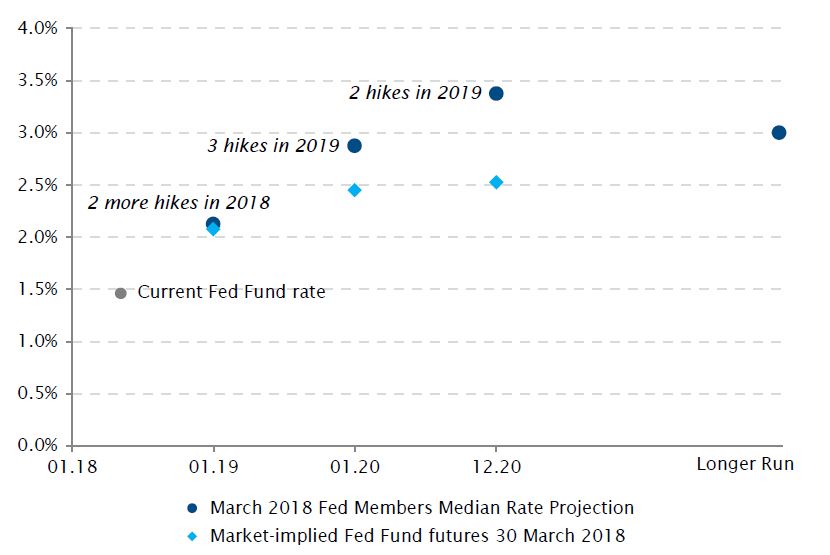
US – Jerome Powell opens his mandate with an (expected) rate hike
The first monetary policy meeting of Jerome Powell as chairman of the Federal Reserve has been a model of continuity, as short-term rates were raised by 25bps. The decision was wrapped in a postivie enough outlook for growth and inflation to confirm that rates will continue to rise. And it was carefully balanced by mentions of below-target inflation and the moderating growth dynamic, avoiding excessive rate hike expectations.
Interestingly, investors are very willing to embrace the Fed’s projection for the months to come, i.e. two more rate hikes by the end of 2018. However, they remained skeptical on the Fed’s ability to extend this hiking cycle much further. Market-based future expectations only price half of the Fed’s expected progress in 2019 and barely any hike beyond that, implying that short-term rates will not reach the long-run level of 3% estimated by the Fed. The difference probably stems from the market including an uncertainty premium in its outlook, while the Fed’s projections rely on a continuation of the favourable macroeconomic trends currently at play. Time will tell which scenario plays out.
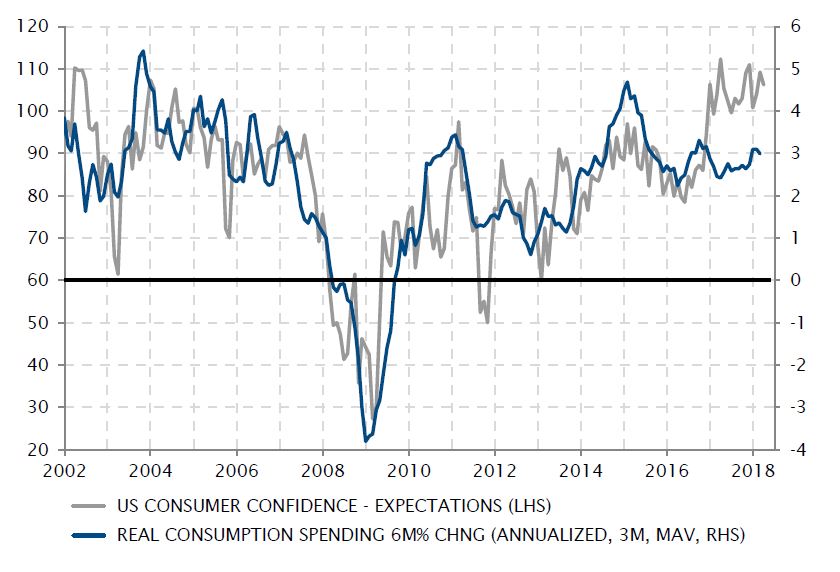
US – Sky-high consumer sentiment contrasts with lacklustre consumption spending
Donald Trump may be good at improving consumer sentiment, but he has not succeeded so far in spurring actual consumption. This is the crude conclusion drawn from the disconnect in the past 18 months between consumer optimism, close to historical highs, and real consumer spending, growing at a stable rate since 2016.
The surge in household expectations had been initially driven by enthusiasm about the tax cut package promised by candidate Trump. Expectations of rising wages in a context of low unemployment may have helped too. However, higher energy prices and the lack of significant wage increases instead depressed the real purchasing power of US households in 2017, forcing them to dig into their savings to simply sustain consumption growth.
This may change once households effectively receive the tax rebate cheque - even if part of that rebate may not be spent and rather used to replenish depleted savings. In any case, it is difficult to imagine consumption accelerating as strongly as confidence indicators suggest. But sentiment may matter most to Mr Trump ahead of the mid-term elections and on that side he seems to be doing just fine.
While household sentiment flies high, consumption growth remains stable
Sources : Bloomberg, SYZ Asset Management. Data as at : 31 March 2018
Activity and confidence indices still point to solid Eurozone GDP growth
Sources : Bloomberg, SYZ Asset Management. Data as at : 31 March 2018
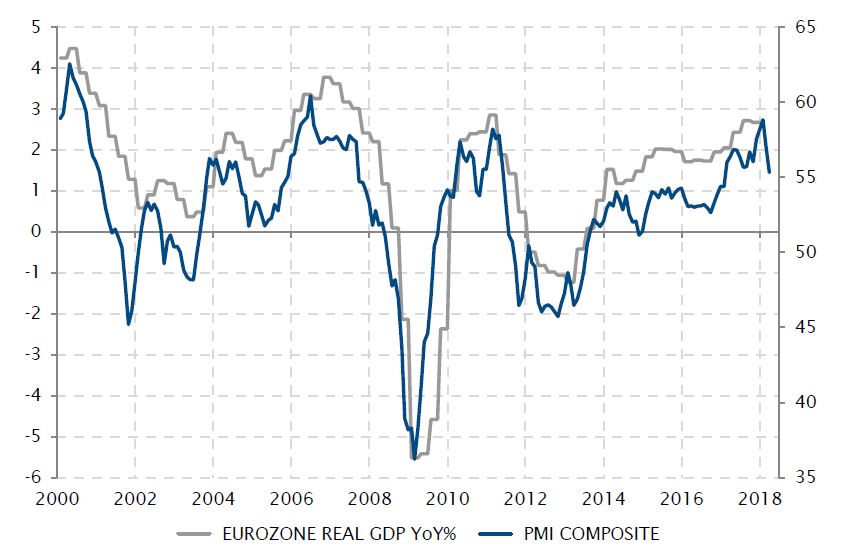
Eurozone – From recovery to mid-cycle expansion
When transitioning from acceleration to cruising speed, the economy can often have the unwarranted feeling of a slowdown. The Eurozone may be going through one of these phases in early 2018.
All real-time indicators of activity and sentiment are moving back from the highs reached at the turn of the year. However, objectively, the glass is still much more than half-full for the Eurozone growth picture. The near-3% pace of annual expansion reached at the end of last year was never going to be sustainable and economic data still points toward an annualised pace of expansion of around 2%, a fairly strong growth rate from an historical perspective.
But investors’ psychology is such that, in this context, it is focused on the empty part of a previously-full glass… The streak of disappointing economic data, including softer inflation data, has taken off some of Europe’s economic shine. On the other hand, it has moderated expectations around the ECB’s monetary policy normalisation, taking off some upward pressure on the euro and European rates. This may facilitate the transition towards a stabilised mid-cycle growth rate - less spectacular, but still enough to drive unemployment lower and fuel corporate earnings’ growth.
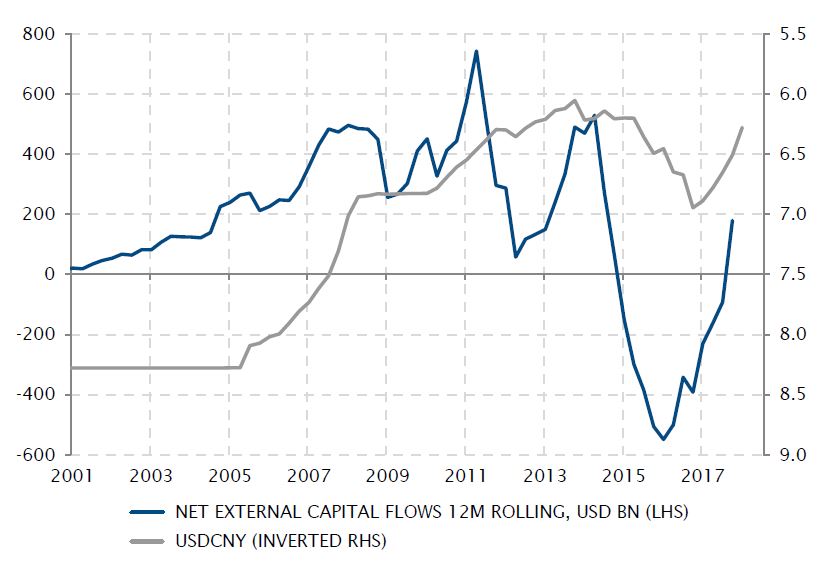
China – A stronger yuan as capital outflows cease
In March, the Chinese yuan extended its appreciation against the US dollar, to end within close range of its pre-2015 devaluation level. If this was not related to the (modest) rate hike announced by the PBoC in the wake of the Fed’s progress towards normalisation, the continuation of supportive activity data may have contributed, but is unlikely to have been the decisive factor.
The recent strength of the Chinese currency has probably more to do with the Government managing to stem the capital haemorrhage that started in 2014. This forced the infamous August 2015 FX regime change and a host of specific measures designed to clamp down on capital outflows from the mainland. Those outflows also drove a 15% depreciation of the yuan vs the US dollar in three years.
With capital flows returning into positive territory, fuelled by the Chinese trade surplus, the downward pressure on the currency has abated since 2017. It is ironic that, at the time when US tariffs are announced, such yuan strength weakens the case for the US administration to label China a currency manipulator.
Capital outflows have been stopped and the yuan has rebounded
Sources : Factset, SYZ Asset Management. Data as at : 31 March 2018
Turkey Real GDP (Annual YoY %)
Sources : Bloomberg, SYZ Asset Management. Data as at : 3 April 2018
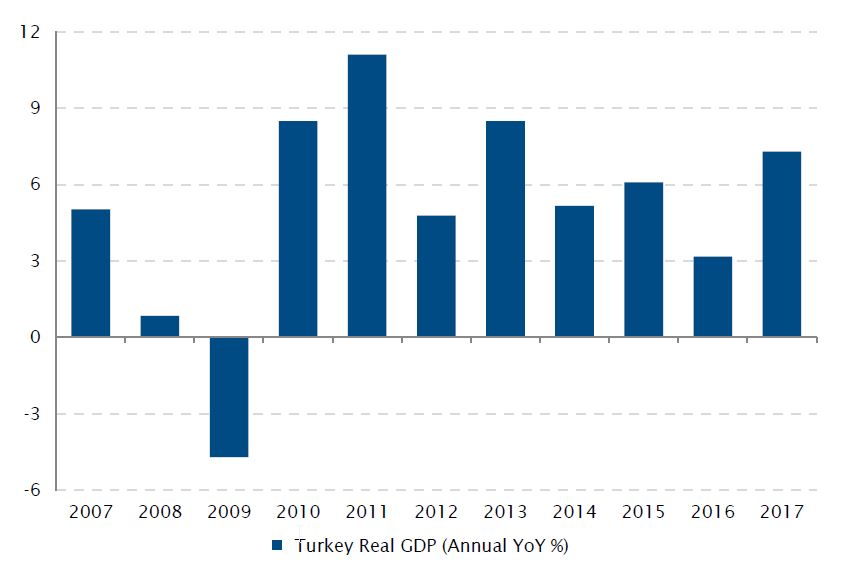
Turkey – Spending surge boosted Turkey’s 2017 growth
Last year, real GDP growth in Turkey reached 7.4%, more than twice the growth rate achieved the year before and the highest since 2013.
Even though the geopolitical situation in the country and the region remains fragile, this high growth regime came on the back of very high consumer and government spending. This diminishes the negative political and economic effects of the failed military coup in 2016.
According to fourth quarter growth figures, Turkey’s GDP print was at 7.3% (the highest in the G20 bloc) but down on a very strong third quarter (11.3%).
This level of growth is not coming without risk, as the economy is overheating and has some large imbalances: double digit inflation and a ballooning current account deficit, both of which are reflected in a weak currency (TRY is down -13.9% since the end of August vs. the USD).
This context led Moody’s to downgrade Turkey’s credit rating to junk status last month.
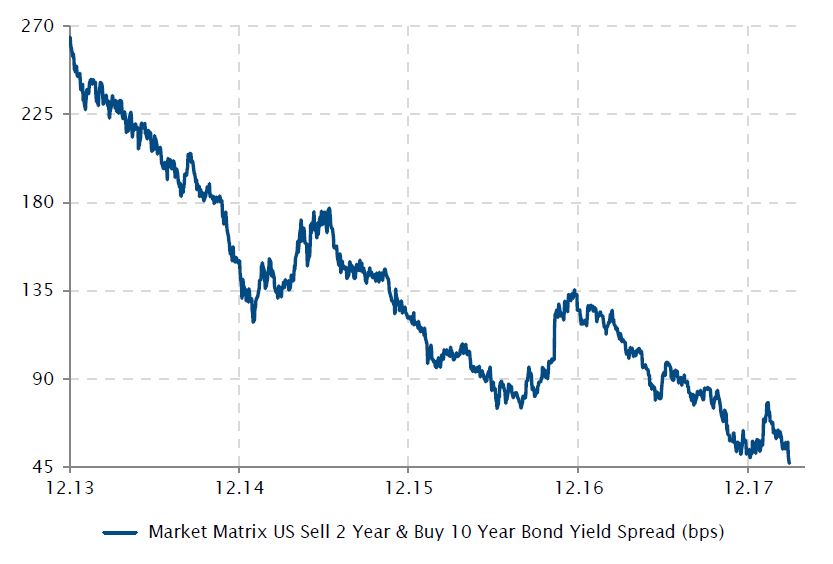
Fixed Income – US yield curve continues to flatten
The Fed’s continued monetary policy normalisation implies higher real yield, especially in the short end, and less upward pressure on the long end of the curve. This points towards the US yield curve continuing to flatten as long as there is no inflation regime change.
Short-term rates have risen more rapidly than long-term rates and the difference has narrowed to an all-time low of 47bps.
Since last September, the acceleration in the Fed’s monetary policy normalisation, coupled more recently with rising unpredictability of the outlook for global growth, other hawkish central banker interventions and the uncertainty surrounding Jerome Powell’s intentions for Fed policy, were contributing to this spread narrowing trend.
Moreover in the US, economic data remains strong, particularly in the manufacturing world for example, but also on the job front. The only missing piece in the equation is inflation, which continues to progress at a mild level, with only some short-term catch-up risks and no long-term inflationary pressures seen yet, keeping a lid on the long end of the curve.
US Treasury 10Y-2Y difference (bps)
Sources : Bloomberg, SYZ Asset Management. Data as at : 3 April 2018
Spanish bond yields fall
Sources : Bloomberg, SYZ Asset Management. Data as at : 30 March 2018
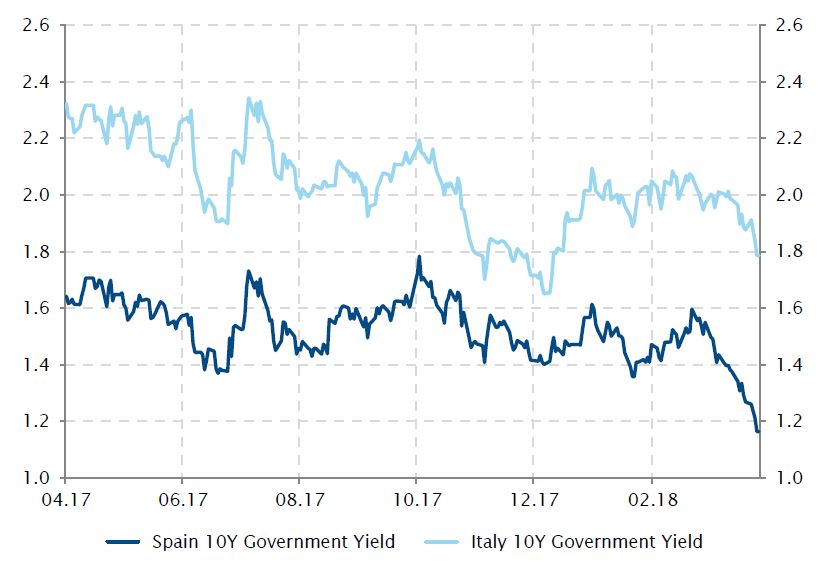
Spain – Vamos !
The high uncertainty induced by the controversial Catalonian referendum seems to be a thing of past for the Spanish economy, after its 10-year bond yield dipped to 1.16%. The country benefited from an upgrade of its sovereign ratings, as well as from a revision of its economic outlook.
Indeed, the Bank of Spain has revised its forecast for economic growth higher, projecting 2.7% growth for this year up from the 2.3% previously expected. Political uncertainty has somewhat eased in Catalonia which, combined with a robust external sector, an improved labour market and a healthy global economic climate, should help to sustain the country’s growth. The latest decision from the credit rating agency S&P to raise Spain’s rating (now A-) also supports a brightening outlook for the economy.
Despite the fact that Spain is expected to grow at a slower pace this year (2.7% vs 3.1% last year), this upgrade remains a positive sign for Europe, especially when economic uncertainty persists in Italy.
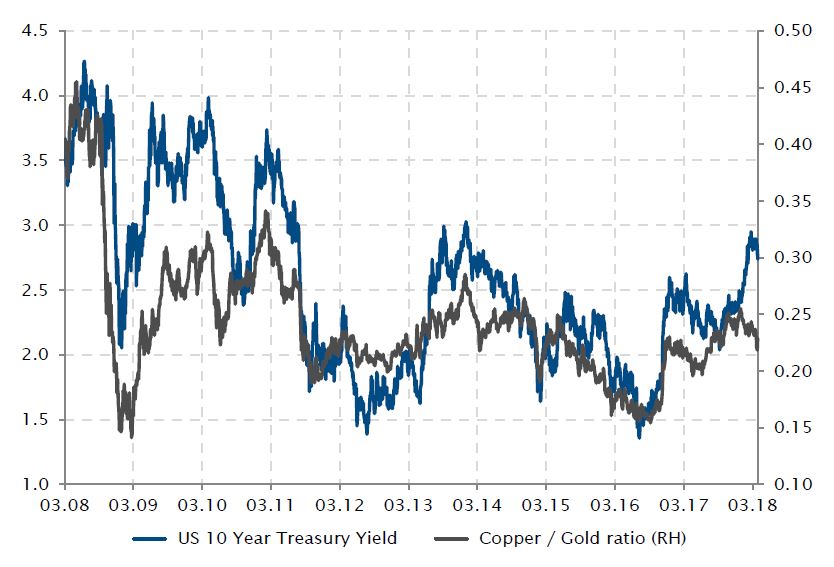
Commodities – A barometer of global growth : the copper/gold ratio
Despite solid economic data, fears of a trade war have materialized on metal prices with copper being under pressure. The copper/gold ratio is seen as a barometer of economic health as the red metal tends to increase during period of robust global growth while gold usually benefits from risk-off environment and rising geopolitical tensions.
The ratio jumped following the US presidential election as copper benefited from Trump’s pro-business agenda with expectations of tax cuts and infrastructure spending. Recently the prospect of a trade war was dominating the headlines, especially with President Trump’s willingness to impose tariffs on USD 50 billion of Chinese imports. Hence, the ratio has gone down since the beginning of the year, with copper posting the first quarterly decline (-8.3%) since Trump’s election in November 2016 while gold ended the quarter in positive territory (+1.0%).
The 10 Year US treasury yield, which followed the directional moves of the copper/gold ratio over the past decade, was moving in opposite direction in January-February with yield getting higher - especially due to a slightly better-than-expected monthly US wages growth -, has finally started to decline in March to 2.74% (-12bp).
The relationship between the 10-year US Treasury and the copper/gold ratio holds in March
Sources : Bloomberg, SYZ Asset Management. Data as at : 4 April 2018
FAANG stocks drop amid sell-off in the technology sector
Sources : Bloomberg, SYZ Asset Management. Data as at : 29 March 2018

Equities – Tech names tumbling
The first quarter of 2018 ends on a bad note for US equities, and especially for the biggest tech names, which started to tumble in mid-march. As always it is extremely difficult, even with hindsight, to identify the catalyst. The best guess centers on the privacy issues surrounding Facebook and its data breach with Cambridge Analytica. Tesla is also facing its own set of issues; one autonomous car crashed and killed its passenger, while the company’s 2025 bond has been downgraded recently by Moody’s on a potential short-term liquidity shortfall. Finally, Amazon is also having a difficult time after its founder, Jeff Bezos, was attacked directly by Donald Trump, who accuses him of not paying the US Post Office correctly.
While tech names have been the top performers for a large number of investors over the past few years, it seems that the wind is changing and sentiment is turning from extremely positive to slightly dubious.
Disclaimer
This marketing document has been issued by Bank Syz Ltd. It is not intended for distribution to, publication, provision or use by individuals or legal entities that are citizens of or reside in a state, country or jurisdiction in which applicable laws and regulations prohibit its distribution, publication, provision or use. It is not directed to any person or entity to whom it would be illegal to send such marketing material. This document is intended for informational purposes only and should not be construed as an offer, solicitation or recommendation for the subscription, purchase, sale or safekeeping of any security or financial instrument or for the engagement in any other transaction, as the provision of any investment advice or service, or as a contractual document. Nothing in this document constitutes an investment, legal, tax or accounting advice or a representation that any investment or strategy is suitable or appropriate for an investor's particular and individual circumstances, nor does it constitute a personalized investment advice for any investor. This document reflects the information, opinions and comments of Bank Syz Ltd. as of the date of its publication, which are subject to change without notice. The opinions and comments of the authors in this document reflect their current views and may not coincide with those of other Syz Group entities or third parties, which may have reached different conclusions. The market valuations, terms and calculations contained herein are estimates only. The information provided comes from sources deemed reliable, but Bank Syz Ltd. does not guarantee its completeness, accuracy, reliability and actuality. Past performance gives no indication of nor guarantees current or future results. Bank Syz Ltd. accepts no liability for any loss arising from the use of this document. (6)