


Global economy - Europe continues to lead
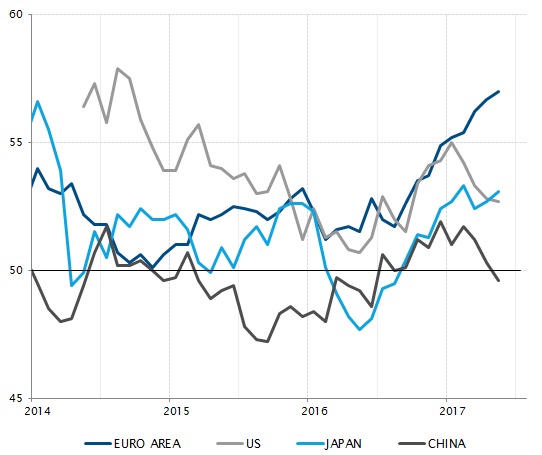
Europe continues to lead global growth momentum. Last month, PMI indices confirmed that the Eurozone is the only area able to sustain its (already strong) expansion rate.
Revised Q1 GDP numbers had confirmed the growth gap between the Eurozone and the US, with EMU GDP up 2.4% in annualized terms in Q1 vs US GDP, which rose 1.2%. While US growth is expected to recover over the course of 2017, there is a very plausible possibility of seeing the Eurozone outpace the US economy again in 2017.
Japan’s economy may seem slightly less spectacular, with GDP up "only" 1% in Q1, but it is also among the bright spots in the global economy: this 5th consecutive quarter of growth makes for the longest expansion streak since 2006. This contrasts China, which is slowing down "on purpose", hampered by the tightening in financial conditions designed to cool down credit growth.
Central banks - The Fed no longer has the largest balance sheet
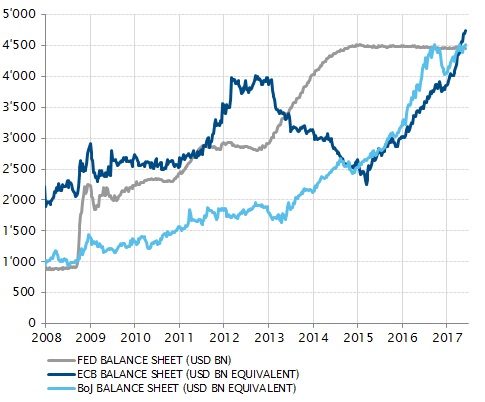
Since 2008, several central banks have had turned to asset purchase programmes to provide additional monetary policy stimulus after having pushed short-term interest rates to zero. The Federal Reserve has been the first mover, with three programmes from late 2008 to late 2014 and a five-fold increase of its balance sheet, to USD 4.5tn. However, the Fed has now ceased asset purchasing, the size of the balance sheet has stabilised and the short-term rate already has risen repeatedly.
The Bank of Japan (BoJ) and the European Central Bank (ECB)B introduced these unconventional monetary policy measures later and are still purchasing assets., The ECB has only mildly slowed its pace since the spring. As a result, the size of their balance sheets keep rising and have collectivelys just overtaken the Fed’s (in US dollar terms). Such monetary policy divergence may explain some of the difference in the growth of the underlying economies.
US - Car sales decline amid tighter credit conditions
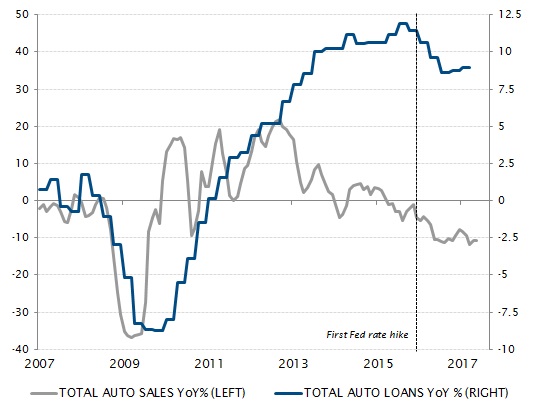
The sensitivity of economic growth to financing conditions is a key issue facing investors given record high indebtedness levels in most sectors and countries. The dependency of economic activity on low interest rates is more important than ever. It is probably one of the factors driving the difference in economic growth in Europe and Japan, still enjoying full monetary policy support, versus China or the US, which are both experiencing some form of monetary policy tightening.
In the US, the auto sector provides a telling example. After 2008, the aggressive easing in financing conditions prompted a sharp rebound in car sales, financed by loans. This continued until the first Fed rate hike in late 2015, which reversed both trends. This is one illustration (albeit a telling one) of how even a cautious attempt at normalising monetary policy can affect credit addicted economies.
US - Not really at full employment
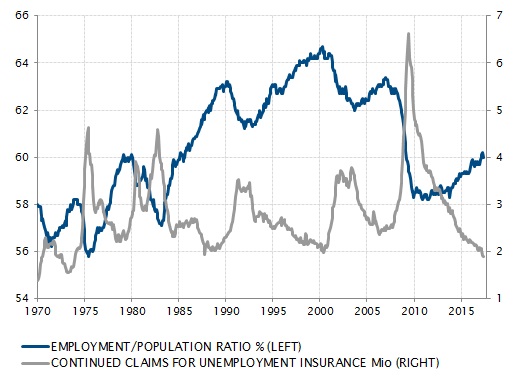
In May, the US unemployment rate dropped to 4.3% and the actual number of registered unemployed fell to its lowest level since 1973. All these indicators, taken at face value, suggest that the US economy is at full employment.
However, they do not capture some key structural changes. Demographics are playing a role, with baby boomers exiting the labour force. But factors such as the rising share of services, the impact of digitalisation and the mismatch between existing skills and new jobs are also changing the structure of the job market.
As such, the share of people actually working within the total population has only slightly rebounded from its 2009 trough and still stands at a depressed level compared to the 1985-2008 period. The lack of upward pressure on wages and of an endogenous rise in consumption spending (when not supported by credit) is maybe not that surprising after all.
China - A tightening of financial conditions underway
In 2015, the slowdown in GDP growth to below 7% raised concerns around the Chinese economy’s outlook, both domestically and internationally.
Chinese authorities did their best, at the time, to stabilise the economy. They used all levers at their disposal: the currency, with a de-anchoring of the yuan from the US dollar; fiscal policy, with targeted support for industries and segments of the real estate market; and monetary policy, with rate cuts across the board and significant liquidity injections. Growth ultimately stabilised, the drawback of this being that credit expansion continued unabated, fuelling concerns around the high level of debt in China.
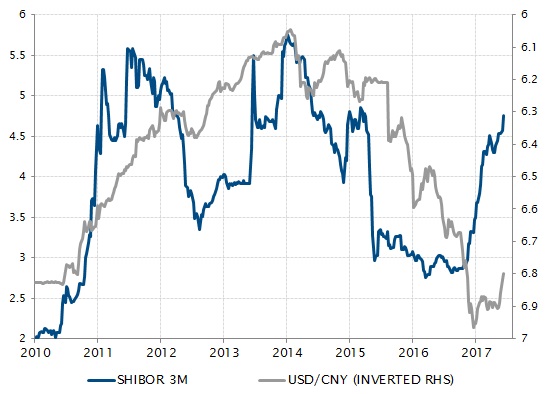
However, since the end of last year, Chinese economic policy stance has changed. With activity stabilised by most metrics, financing conditions have been tightened in order to rein in credit growth. The 3-month interbank rate (Shibor) has risen from below 3% to above 4.5%. The yuan is up 2% against the US dollar in 2017.
FX - Limited upside for the euro in the short run
After a strong post-Trump rally, the US dollar has been losing ground in 2017. The fall has been especially pronounced versus the euro, which has benefitted from declining political risk, improving growth conditions and speculation around some ECB policy normalisation.
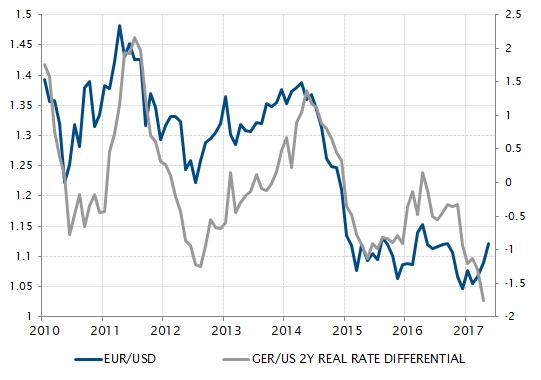
However, after having reached EUR/USD 1.12, the upside potential now appears limited in the short run. The economic and political situation cannot improve much further in Europe and rising consensus expectations raise the risk of disappointment at some stage.
More fundamentally, one of the key drivers of the EUR/USD cross rate suggests some euro weakness in the short run. The short-term real yield differential between the two currencies continues to be in favour of the US dollar as the Fed is raising rates while the ECB isn’t, despite inflation recovering in Europe almost as fast as in the US.
Equities – US technology sector leading the market rally
The US equity market has reached another new high pushed by a strong rally in growth stocks (i.e. technology) while value stocks (which are cheaper) were out of favour: year-to-date, the S&P 500 Growth and S&P 500 Value indices are up 13.8% and 2.9% respectively.
The difference in performance between growth and value stocks stands nearly as high as during the 2000 technology bubble.
The sectors driving the growth style outperformance have mainly been technology subsectors internet, software and hardware.
The so called FAANG stocks (Facebook, Apple, Amazon, Netflix and Alphabet, the holding company of Google) have all posted YTD performances above 30% except Alphabet at 25%.
Moreover, the ten leading contributors to the S&P 500 performance so far this year have accounted for as much as 47% of the total performance, with six of these companies being part of the technology sector.
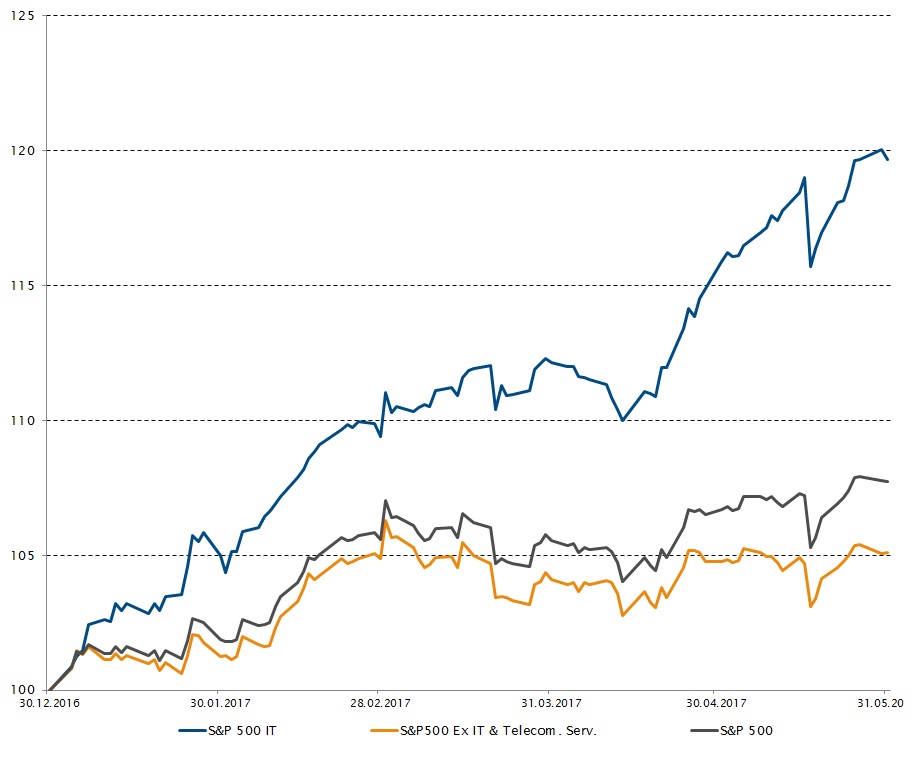
If we strip out the technology sector, the index’s performance looks less impressive. On a YTD basis at the end of May, the S&P 500, S&P 500 Information Technology and S&P 500 Ex IT and Telecommunication Services have returned respectively +7.7%, +19.7% and +5.1%.
Fixed Income – European high yield yielding less than equities
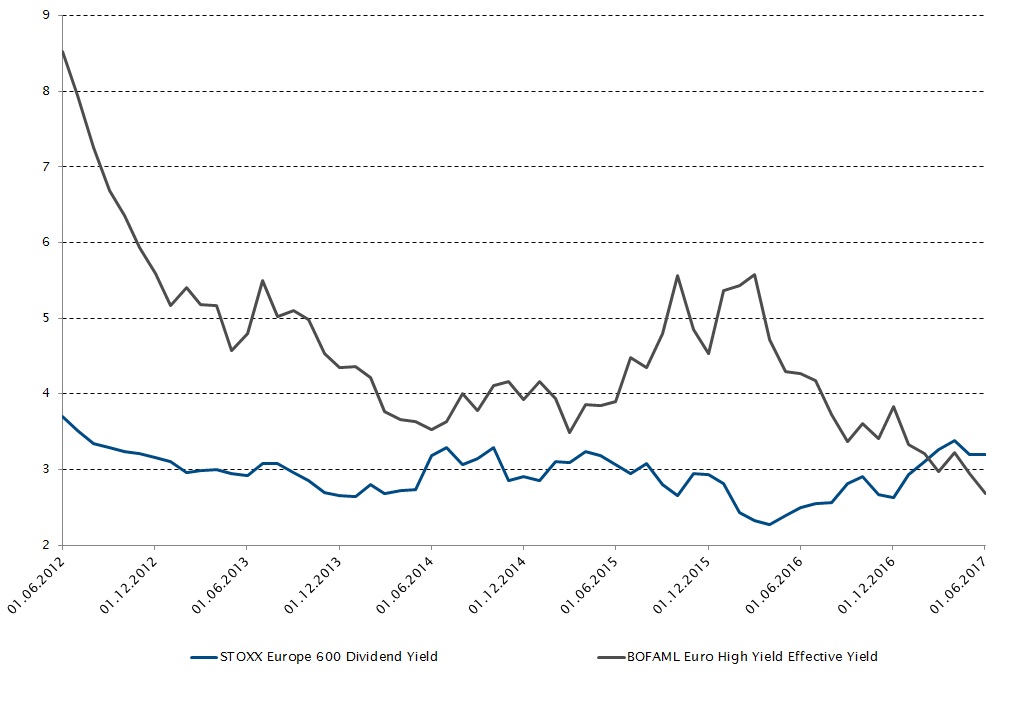
Historically, the effective yield on European High Yield has always been much higher than the equity dividend yield in Europe (5.6% vs. 2.7% for example in October 2015).
At the end of May, equities as represented by the Stoxx Europe 600 index carried a dividend yield of 3.2% higher than the BOFAML Euro High Yield index currently carrying an effective yield of 2.7%.
On the other hand, in the US the difference is still healthy with the S&P 500 yielding 1.9% on trailing dividends and the broader US High Yield index producing an effective yield of 5.5%.
This underlying expensiveness in European high yield bonds is growing because demand is outweighing supply as investors are still hunting for yield in a world of ultra-low interest rates.
In this context, the BOFAML Euro High Yield index posted a positive performance of 0.9% in May and 3.7% YTD compared to 0.5% and nil for the EMU Broad market.
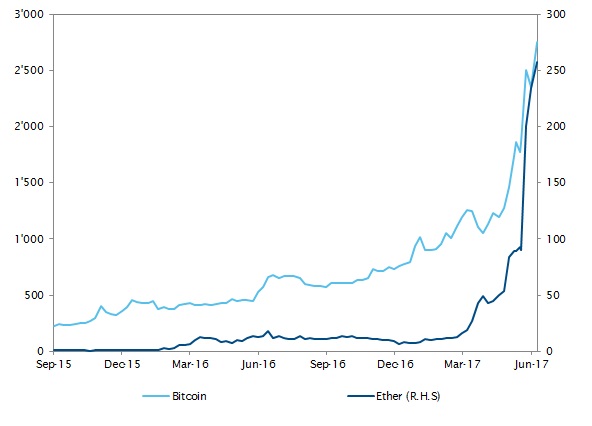
Cryptocurrency - Bitcoin and Ether on the up
The cryptocurrency sphere is currently going through a particularly exciting period. Bitcoin hit an all-time high in May at USD 2,790 before retreating to USD 2,300, with YTD performance of more than 140%. But Ether (ETH), its closest rival, enjoyed an even more impressive rise with a YTD return of 2700%.
The Japanese government’s decision to recognise both digital currencies as legal means of payment explains in large part these price accelerations. But for Ether, the growing interest in its underlying technology of blockchain (Ethereum) is also an important factor in its skyrocketing performance. Its incorporation of smart contract applications has attracted major companies worldwide including JP Morgan, Samsung, Microsoft and Merck.
Although cryptocurrencies are still seen as speculative investments, there is a growing consensus that they are set to play a major role in the future of money.
Volatility - Volatility hitting record lows
Volatility, measured by the VIX, has hit record lows during the month of May. Geopolitical tensions between the US and North Korea and the erratic behaviour of crude oil prices over the month were not enough to lift volatility. Not only has the spot VIX hit its record low since 1994 at 9.75, but it is worth noting that the entire future curve traded below 16 for the first time since 2007. Investors continue to allocate to ETFs shorting volatility, which are adding downside pressure on the short end of the VIX futures curve.
Investors should keep in mind that low volatility has very little to no predictive power over future market returns. To the contrary, current levels of volatility coupled with strong market returns should speak in favour of allocating some budget to buy protection strategies in case of a sudden and unexpected market downturn.

Disclaimer
This marketing document has been issued by Bank Syz Ltd. It is not intended for distribution to, publication, provision or use by individuals or legal entities that are citizens of or reside in a state, country or jurisdiction in which applicable laws and regulations prohibit its distribution, publication, provision or use. It is not directed to any person or entity to whom it would be illegal to send such marketing material. This document is intended for informational purposes only and should not be construed as an offer, solicitation or recommendation for the subscription, purchase, sale or safekeeping of any security or financial instrument or for the engagement in any other transaction, as the provision of any investment advice or service, or as a contractual document. Nothing in this document constitutes an investment, legal, tax or accounting advice or a representation that any investment or strategy is suitable or appropriate for an investor's particular and individual circumstances, nor does it constitute a personalized investment advice for any investor. This document reflects the information, opinions and comments of Bank Syz Ltd. as of the date of its publication, which are subject to change without notice. The opinions and comments of the authors in this document reflect their current views and may not coincide with those of other Syz Group entities or third parties, which may have reached different conclusions. The market valuations, terms and calculations contained herein are estimates only. The information provided comes from sources deemed reliable, but Bank Syz Ltd. does not guarantee its completeness, accuracy, reliability and actuality. Past performance gives no indication of nor guarantees current or future results. Bank Syz Ltd. accepts no liability for any loss arising from the use of this document. (6)