The US yield curve is a closely watched gauge by economists to assess the health of the overall economy. An inversion is linked to an economic slowdown and possibly recession. The below chart is visually telling of the historical yield curve inversions and recessionary periods.
Focus
Latest yield curve Inversion: 5 questions for Global Equity Investors
Monday, 09/09/2019Key takeaways
- Economists believe yield curve inversions signal recession. Historic stats are in favor, though there are also exceptions such as 1998.
- 2019 looks comparable to 1998, and Fed’s actions in 1998 led to multiple-years of equities rally. But Central banks held much larger fire power then, compared to 2019.
- It is impossible to form a firm opinion on the direction of the markets, especially given the protectionist ‘Trump Tweets’ which are unpredictable in timing and direction.
- However current economic conditions of extremely low interest rates, market volatility and other late cyclical symptoms create a favorable environment for dividend stocks.
- On traditional valuation metrics like P/E multiples equity valuations may seem rich, but when compared on cash flow metrics like free-cash-flows yields and dividends yields, they still look very appealing vs. available yield on bonds.

Shoaib Zafar
Analyst
“The current economic conditions of extremely low interest rates, market volatility and other late cyclical symptoms create a favorable environment for dividend stocks”
1. What’s the US yield curve inversion story?
Spread between US 10-year and 3-month Treasury Yields vs. US Recessions
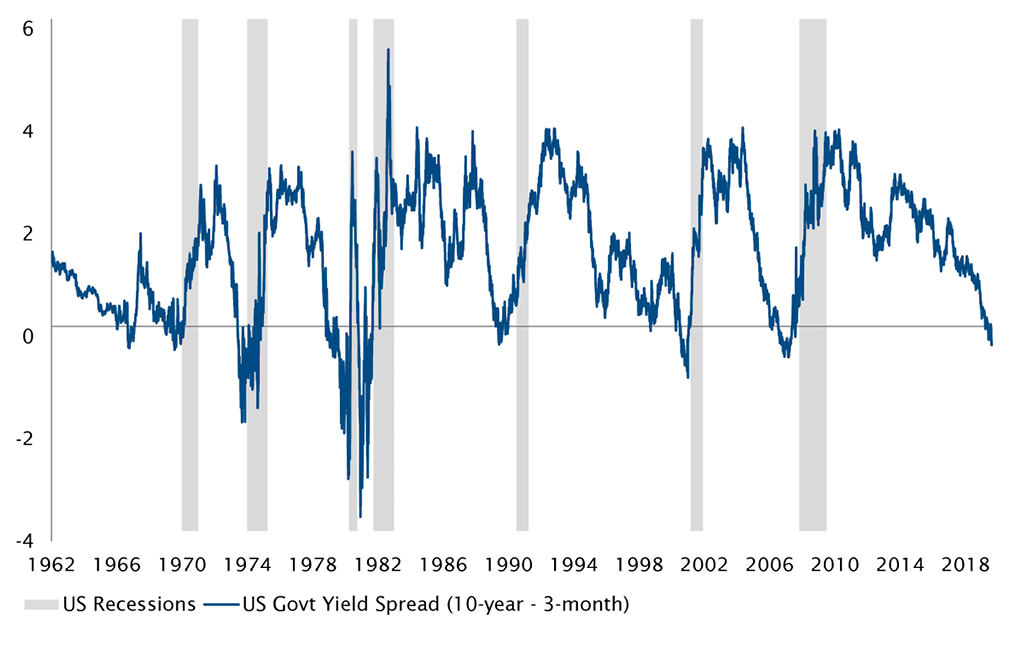
Source
Bloomberg, 27 August 2019
During August, the yield curve on US treasury bonds inverted. The spread has also been narrowing across Europe, with 10-year yields already in the negative territory for some countries including Switzerland and Germany (chart below).
Global 10-Year Yields (%)
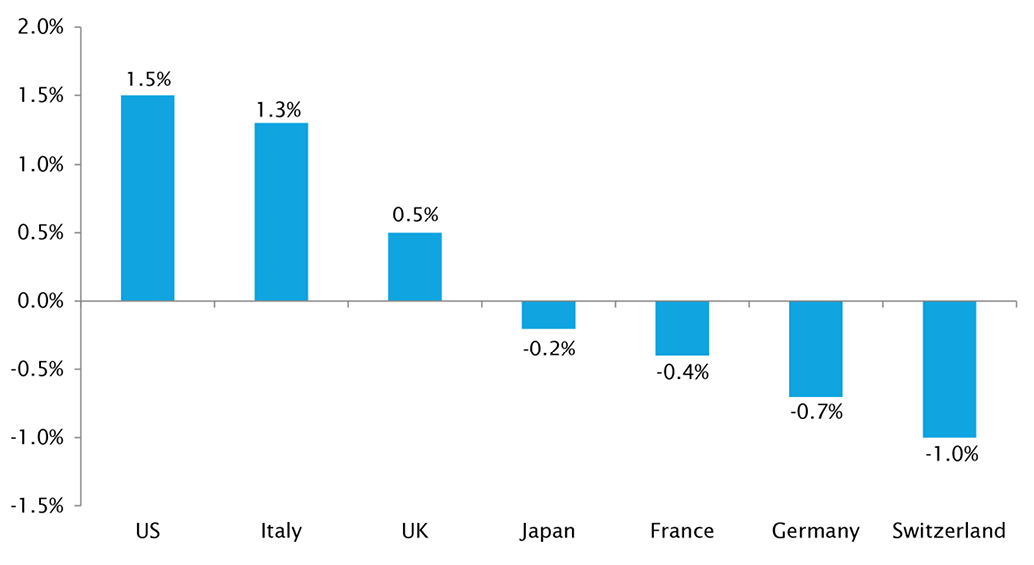
Source
Bloomberg, 27 August 2019
2. What to make of the latest inversion in current circumstances?
It might help to compare 2019 with one of the two previous exceptions when curve inversion was not immediately followed by recession, namely 1998. Late 90s were late in the economic cycle just like late 2010s, and late cyclical signs started emerging with weakening of manufacturing PMI and oil price into the curve inversion. Same is true for 2019. Also similar is a dovish Fed ahead of the inversion of 1998 that restarted easing the same year.
It remains to be seen if the latest inversion will be similarly followed by a multi-year market rally that began after Fed’s action in 1998. However multiple quantitative easing rounds of this decade may have left central banks with far less fire power in 2019 than ever before.
What blurs the situation is a questionable ability of the yield curve shape to gauge the health of the economy in today’s settings. This is again due to substantial quantitative easing which has probably distorted how economies function, and the presence of global protectionism-induced pessimism.
3. Any positive economic signals around?
There are several economic signals that are holding up relatively well. Examples include high private consumption and consumer confidence. This is mainly thanks to strong job markets in most parts of the world, rising wages and steady gains on investments on majority of asset classes.
A closely watched indicator is the Citi Economic Surprise Index. Economic data surprises have improved in recent months, with Global data having been relatively more stable over 1-year period.
In addition, the global corporate earnings season just finished and it was a decent print overall.
4. How should Global Equity Investors position?
Let’s make no mistake we’re already late in the cycle, tiptoeing on a thin and fine line between late cyclical conditions and rich assets valuation and more importantly investors are starved for yield generating investments.
Having said that, the macro-backdrop with extremely low global yields, looks perfectly appertaining to the highly liquid, cash generating, and disciplined dividend paying businesses. Among attractive characteristics of dividend paying businesses is their relative defensiveness (predictable revenue sources and distribution of cash).
Dividend growth is another attractive characteristic. The fastest dividend growth over next three years is expected to come from Information technology, financials, and healthcare sectors (combined c.10% 3year cumulative annual growth rate). Traditional dividend sectors of utilities and real estate are also projected to grow dividends decently by 4% over the next 3 years.
The team views the current environment as ideal for maintaining the core composition (c.50% of the portfolio weight) in extremely high quality dividend paying businesses such as Unilever, Merck and NextEra Energy. These are the ‘Anchor’ stocks for the fund, allowing both sustained capital gains and predictable dividend income. A large majority of these positions have been held for over 5 years.
We value dividend growth, and therefore an ‘Accelerators’ basket (c.35% of the portfolio weight) composed of niche businesses such as Infosys and Mowi, allows us to capture growth in dividends. Many of these companies are still in their growth phase, and decide to pay dividends from the excess cash they consistently generate.
A relatively smaller exposure (c.15%) is maintained to new business models (lower cash needs, expanded margins and richer cash generation) such as Blackstone. This is an Opportunistic basket and that also allows the fund to maintain exposure to the economic-sensitive segment of the market.
The fund’s current dividend yield is 4.3% (projected next 12 months), and is highly appealing in the context of negative yielding ‘govies’ and another bunch of income asset classes yielding low.
Current Yield (%) of various income asset classes
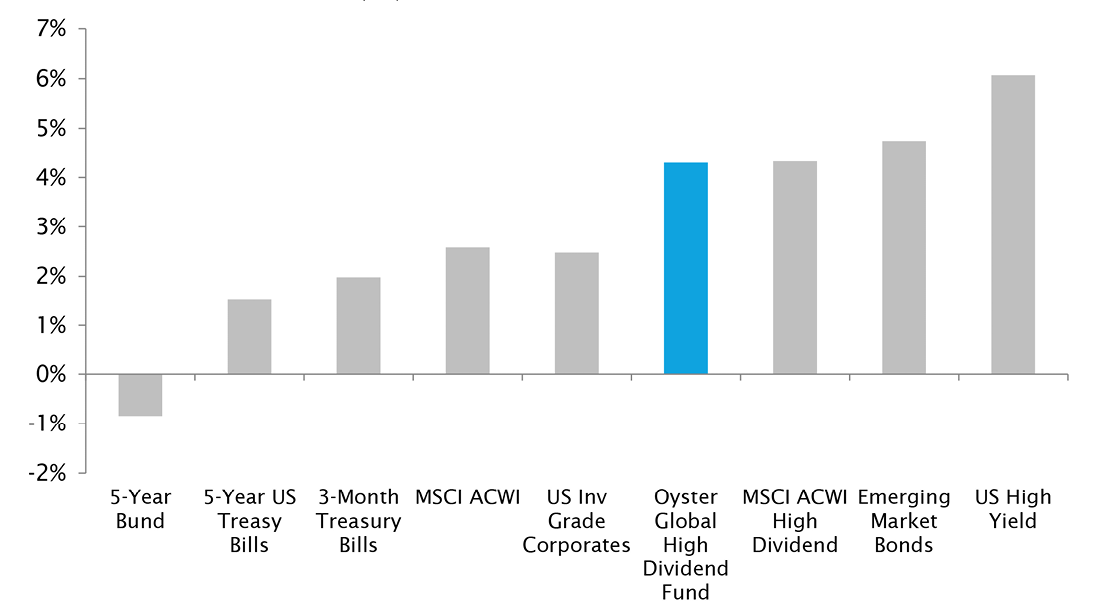
Source
Bloomberg, 27 August 2019
5. But aren’t valuations too rich?
A key concern for equity investors is current valuations, and on traditional metrics like Price-to-Earnings, justifiably so. But when compared on cash flow metrics such as free cash flow yield, and the available yields on credit, equities look far more attractive.
The MSCI ACWI Index (along with many other global equity indices) currently yields superior to the US 10year Treasury (spread chart below). This provides a historically strong support for equities.
MSCI ACWI Dividend Yield – 10 year US Treasury Yield Spread (%)
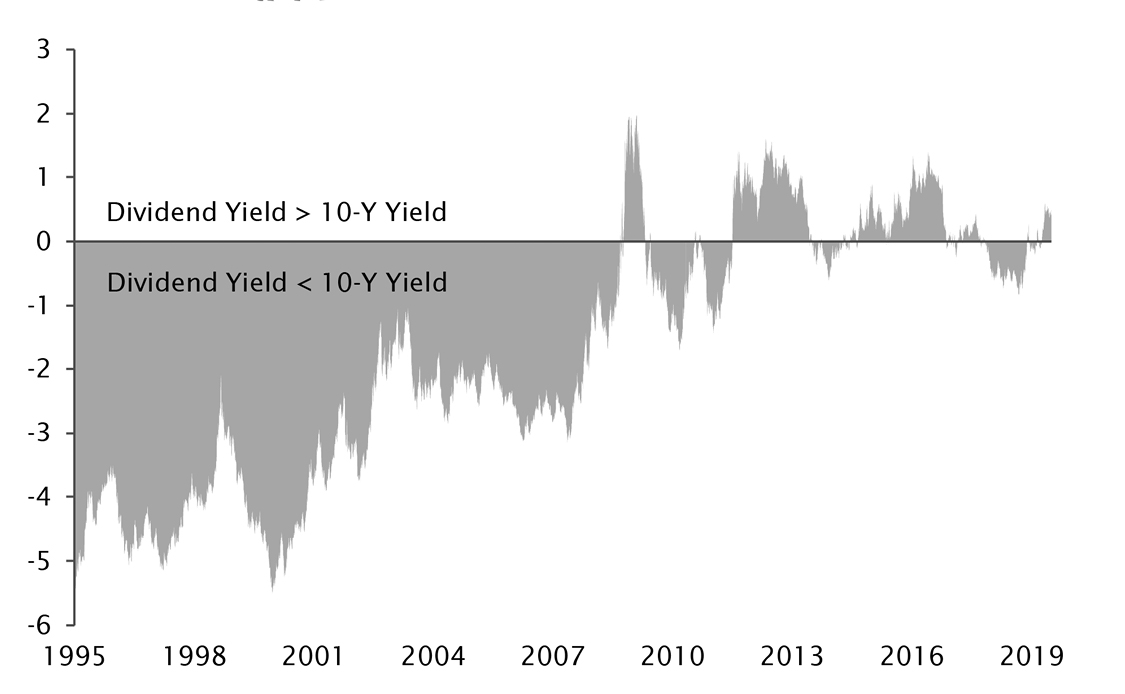
Source
Bloomberg, 27 August 2019
Conclusion
The latest yield inversion didn’t go unnoticed by the global investor community, and is perhaps a reflection of excessive nervousness built into the market presently. Principle driver of that nervousness is likely trade wars-induced uncertainty rather than a tangible global economic slowdown. But let’s make no mistakes; we’re late in the cycle with zero-to-extremely low rates and general volatility being byproducts of the current phase. As long as global economic conditions continue to hold and fundamentals of capital markets don’t worsen, we don’t see any reasons to throw the towel on Global Equities.
Disclaimer
This marketing document has been issued by Bank Syz Ltd. It is not intended for distribution to, publication, provision or use by individuals or legal entities that are citizens of or reside in a state, country or jurisdiction in which applicable laws and regulations prohibit its distribution, publication, provision or use. It is not directed to any person or entity to whom it would be illegal to send such marketing material. This document is intended for informational purposes only and should not be construed as an offer, solicitation or recommendation for the subscription, purchase, sale or safekeeping of any security or financial instrument or for the engagement in any other transaction, as the provision of any investment advice or service, or as a contractual document. Nothing in this document constitutes an investment, legal, tax or accounting advice or a representation that any investment or strategy is suitable or appropriate for an investor's particular and individual circumstances, nor does it constitute a personalized investment advice for any investor. This document reflects the information, opinions and comments of Bank Syz Ltd. as of the date of its publication, which are subject to change without notice. The opinions and comments of the authors in this document reflect their current views and may not coincide with those of other Syz Group entities or third parties, which may have reached different conclusions. The market valuations, terms and calculations contained herein are estimates only. The information provided comes from sources deemed reliable, but Bank Syz Ltd. does not guarantee its completeness, accuracy, reliability and actuality. Past performance gives no indication of nor guarantees current or future results. Bank Syz Ltd. accepts no liability for any loss arising from the use of this document. (6)