- 6. Equities – Sectoral rotation between value and growth style
- 7. Bonds – Outperformance of High Yield and Emerging Market debt
- 8. Interest rates – Long term rates reflect Fed/ECB policy divergences
- 9. China – China sold 10% of its US Treasuries in 2016
- 10. Global – Uncertainty remains high, but not with traditional measures such as the VIX


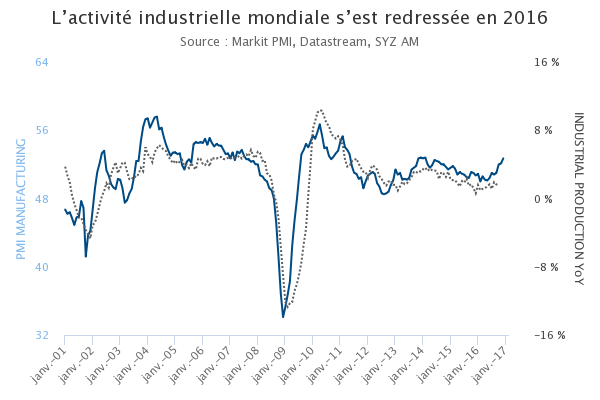
Global economy – Ending 2016 on a positive cyclical dynamic
2014 and 2015 had been two years of slowing and depressed activity for the industrial sector. Excess capacities (especially in China), weaker-than-expected final demand, the sudden fall in oil prices and dollar strength lead global manufacturing activity to stall and even contract in several economies.
2016 has been the year of the recovery for the industrial sector. Rebounding oil and commodity prices, resilient final demand in the US, catch up needs in the Euro area, growth stabilization in China and a halt in the US dollar appreciation favored an improvement in industrial activity across the board.
Therefore, the global economy closed the year 2016 on a positive cyclical dynamic not observed since 2013. Unlike a year ago, this helps keeping recession concerns away for 2017. Still, remaining excess capacities continue to weight on investment spending and are likely to cap this encouraging trend in the course
of the year.
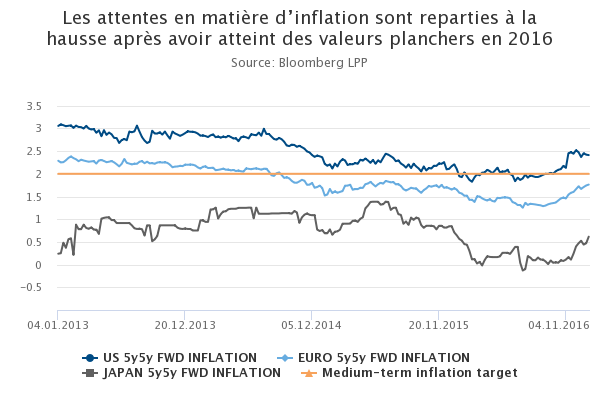
Global economy – From deflation to reflation
The post-2008 crisis period has been generaly characterized by subdued inflationary pressures, with cyclical elements (elevated unemployment, fiscal retrenchment…) adding to structural headwinds for inflation (demographic trends, high debt level). In such a context, the fall in energy and commodity prices of 2014/2015 was enough to trigger deflation fears, with a fall in medium term inflation expectations in the developed world.
In the second half of 2016, a combination of rebounding commodity prices and encouraging economic indicators, supported by continuously accommodative monetary policies by most major central banks, managed to reverse the downward trend. The election of Donald Trump and the prospect of a significant fiscal stimulus only extended the rebound.
However, if this movement has dissipated short-term deflation fears, it is still far from reflecting concrete inflation risk. Medium term expectations, if higher that a year ago, remain low in absolute terms, essentially for the structural factors mentioned earlier.
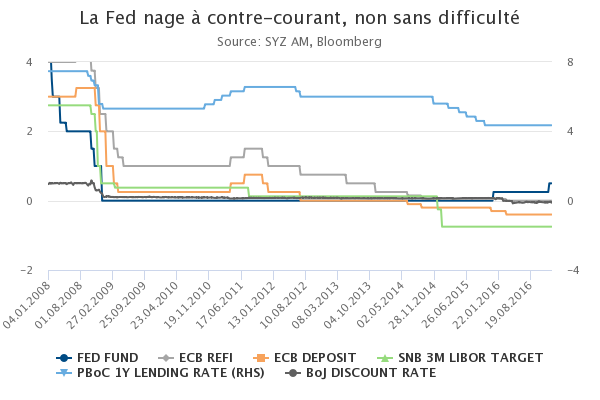
Global economy – The Fed as the lonesome hiker
On December 14th, the Fed raised its key Fed Fund rate to 0.75%, one year after a first 25bp hike. It was fully expected by investors and the only (mild) surprise was the increase in the number of rate hikes expected for 2017, from 2 to 3.
The tentative normalisation of rates in the US is an exception in a context of very supportive monetary policies across the developed world. In 2016, the ECB cut the deposit rate further into negative territory and raised the amount and scope of monthly asset purchases. The BoJ dipped unsuccessfully into negative rates and later introduced anchoring of 10-year government rates around 0%.
With rebounding inflation expectations, further monetary easing seems unlikely in 2017 and investors’ attention is turned to hints for normalization. But central banks are forced to err on the cautious side given the sensitivity of debt-laden economies’ growth to financing conditions.
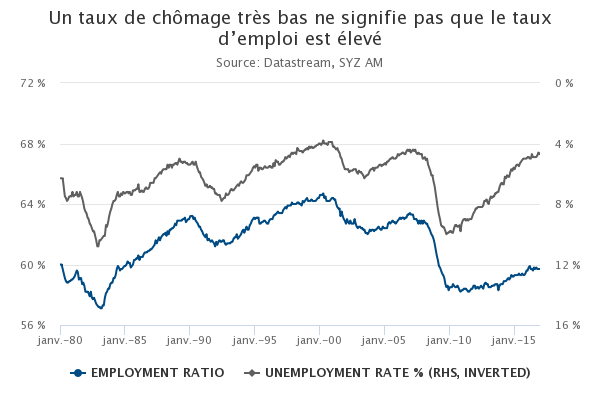
US – The unemployment rate declines further but…
In 2016, the unemployment rate in the US dropped to 4.6%, its lowest level since 2007 and close to historic lows. According to this indicator, the US economy has completely offset the 2008/2009 recession.
The reality is unfortunately not so bright and may help to explain why, despite such an apparently strong job market, GDP growth remains lackluster. The unemployment rate measures unemployment within the active population, defined as people either working or seeking to work. But the share of this active population within the total population has kept declining since 2008, mainly because of structural demographic trends.
As a result, despite a very low unemployment rate, the employment ratio (the share of people being employed within the total US population) still remains well below levels of the previous 25 years. The US economy may look like it is at full employment, but this is not the same kind of full employment as it was 10 or 20 years ago…
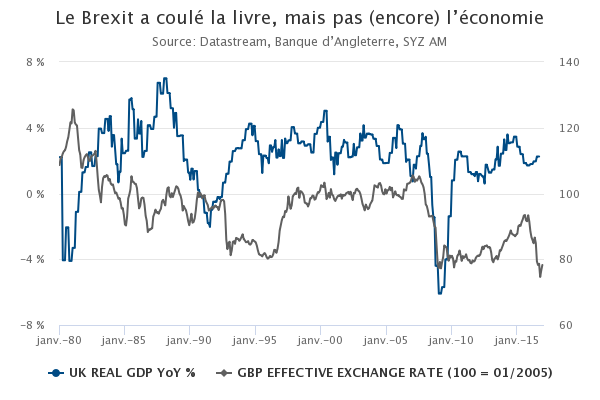
UK – Expected and unexpected consequences of the Brexit vote
In 2016, the UK people decided to exit the EU. Some of the consequences of this vote have been conform to expectations, while some have been much more surprising.
Let’s start with the expected: the GBP dropped and hit a 30-year low against the US dollar. In the two days following the vote, the MSCI World index fell -7%. Also unsurprising, the Bank of England decided to ease its monetary policy. Consumer and business confidence indicators indeed fell in early July.
So much for the expected… Contrary to most economists’ expectations (including us), confidence indicators quickly bounced back. GDP was up +0.6% in Q3. Not exactly a recession scenario… After the initial drop, equity markets rebounded rapidly and strongly, including the UK market that closed the year among the top performers in local currency terms.
With formal discussions around Brexit terms and condition due to start this year, however, growth remains prone to headwinds in the coming months.
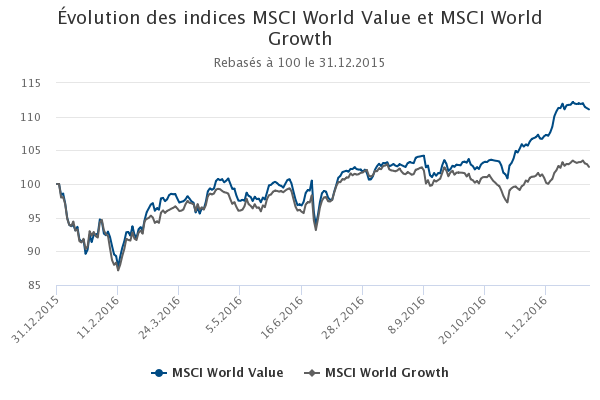
Equities – Sectoral rotation between value and growth style
Since a few years, growth stocks have been structurally outperforming value stocks. We can identify a strong correlation between US Treasury 10Y yield and the outperformance of value style over growth i.e. when US 10Y rate increases, value investing tends to outperform growth. Moreover, value is recently trading at a discount to growth on a price to book ratio for example.
With the US monetary policy that is turning more restrictive since one year and hence bringing some upside pressure on interest rates, it is supporting the case for a return to value investing as we saw at the end of 2016.
Nevertheless, the market could be overconfident by giving a too high probability to a sustainable and accelerating rate rising cycle coupled with also an overpricing in earnings momentum. Finally, in the short term, the recent euphoria linked to Trump’s victory could also be slowly fading away when he will enter in function on the 20th of January.
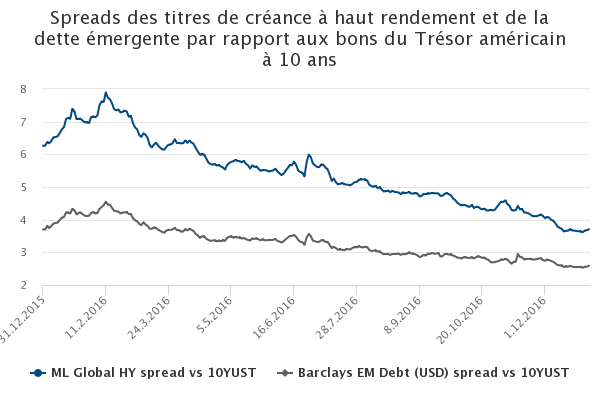
Bonds – Outperformance of High Yield and Emerging Market debt
After a difficult beginning to the year, the return of risk appetite has led to a strong performance of asset prices related to global growth. In this context, High Yield and Emerging Market debt saw their spreads tightened
last year.
In terms of performance, Global High Yield and Emerging Market debt (in hard currency) finished the year on a strong note: respectively +14.3% and +10.2% compared to +2.7% for the Barclays US Aggregate index.
The combination of a softer dollar compared to 2015 (US Dollar index was up in 2016 and 2015 respectively +3.6% and +9.3%), central banks’ accommodative stance in most countries and emerging economies that have healthier fundamentals than in the past has attracted investor flows to Emerging Market debt.
Finally, at the end of the year, Emerging Market debt and especially the High Yield market benefited from the risk on environment following the election of Donald Trump in the US coupled with some further recovery in the oil price.
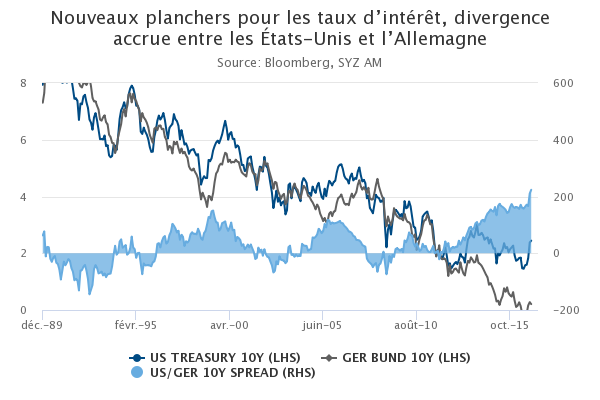
Interest rates – Long term rates reflect Fed/ECB policy divergences
2016 has been a year of two halves for long term interest rates. During the first part of the year, concerns around the growth outlook and fears of deflation, topped by accommodative central banks, pushed 10-year government to new historical lows on both side of the Atlantic (1.36% for US Treasury 10y, -0.19% for German Bund 10y).
Then interest rates rebounded during the 4th quarter as growth and deflation worries dissipated. However, the movement was much more pronounced on US rates, spurred by the prospect of a large fiscal stimulus under the Trump administration and, in parallel, a more hawkish Fed going forward. In the meantime, European rates rose more modestly as the ECB extended its QE program till the end of 2017.
As a consequence, the interest rate spread between US Treasury and Bund 10y rates, already large since Fed and ECB monetary policies started to diverge in 2013, widened further to a level not seen since 1989.
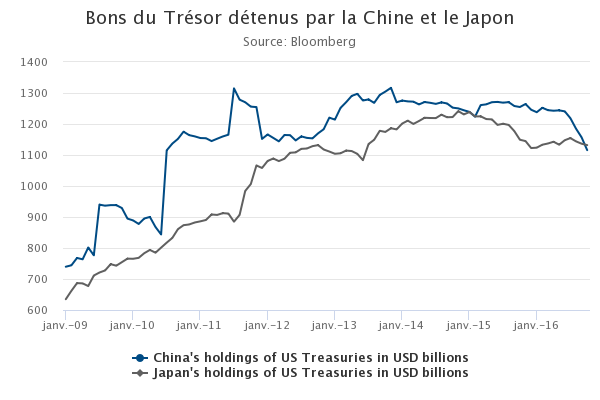
China – China sold 10% of its US Treasuries in 2016
December revealed the latest figure for 2016 for TIC data. This data shows the holding of US treasuries by foreign government and is often used as a gauge of international confidence in the US monetary system.
For the first time, Japan surpassed China as the biggest holder of US treasuries as the latter continues to dump treasuries. China aims to stabilize its currency through the massive sale of treasuries as the country is at the same time seeing worrying outflows of assets. Drivers of outflows are mainly the fear by investors of a continued devaluation of the Yuan as well as the recent steady slowdown in growth.
Although President-elect Trump has mentioned that China is manipulating its currency, recent action tends to demonstrate that China wants to avoid a disorderly devaluation. Finally, so far the unwinding of US Treasuries by China has had little impact in terms of raising US interest rates as the demand for the US debt remains robust.
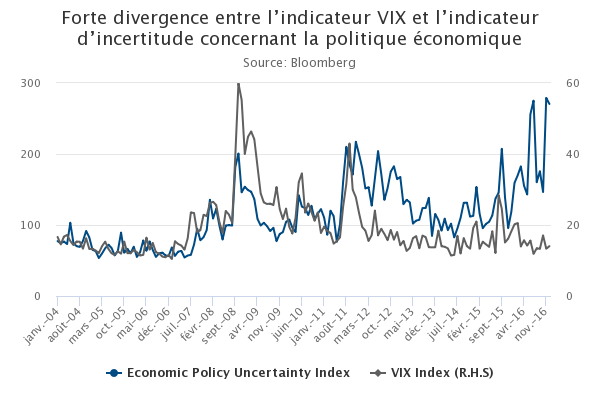
Global – Uncertainty remains high, but not with traditional measures such as the VIX
When it comes to quantifying uncertainties, most investors and market participants will turn at the VIX which is a measure of implied volatility in US equities. However, volatility has been compressed over the recent years following the omnipresence of Central Banks holding the hand of the market during difficult times.
The Economic Policy Uncertainty Index is built using news search algorithm looking for the terms Economic, Policy and Uncertainty in news and is designed as a frequency measure.
Most recently, EPU and VIX started to disconnect although intuitively they should track each other closely. The most likely explanation is that markets are getting used to deal with policy uncertainty and the presence of Central Banks is reassuring. The stress generated by Brexit lasted a few days, Italian Referendum was some hours while the US election was a matter of minutes before the reversal.
Disclaimer
This marketing document has been issued by Bank Syz Ltd. It is not intended for distribution to, publication, provision or use by individuals or legal entities that are citizens of or reside in a state, country or jurisdiction in which applicable laws and regulations prohibit its distribution, publication, provision or use. It is not directed to any person or entity to whom it would be illegal to send such marketing material. This document is intended for informational purposes only and should not be construed as an offer, solicitation or recommendation for the subscription, purchase, sale or safekeeping of any security or financial instrument or for the engagement in any other transaction, as the provision of any investment advice or service, or as a contractual document. Nothing in this document constitutes an investment, legal, tax or accounting advice or a representation that any investment or strategy is suitable or appropriate for an investor's particular and individual circumstances, nor does it constitute a personalized investment advice for any investor. This document reflects the information, opinions and comments of Bank Syz Ltd. as of the date of its publication, which are subject to change without notice. The opinions and comments of the authors in this document reflect their current views and may not coincide with those of other Syz Group entities or third parties, which may have reached different conclusions. The market valuations, terms and calculations contained herein are estimates only. The information provided comes from sources deemed reliable, but Bank Syz Ltd. does not guarantee its completeness, accuracy, reliability and actuality. Past performance gives no indication of nor guarantees current or future results. Bank Syz Ltd. accepts no liability for any loss arising from the use of this document. (6)