


World economy - The IMF confirms the positive global growth dynamic
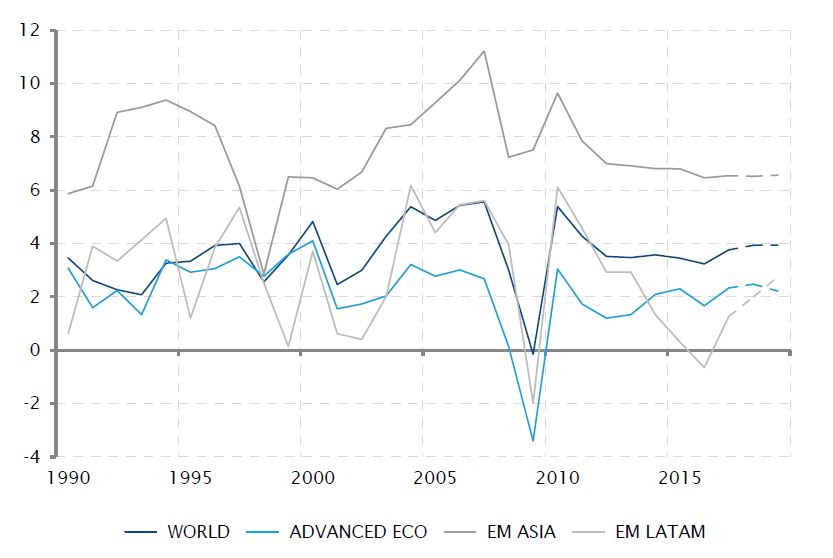
The latest update of the International Monetary Fund’s economic projections has confirmed the consensual view: the global economy is in good shape. It should record a slight growth acceleration in 2018 to 3.9%, from an already elevated pace of 3.8% in 2017, and this situation is expected to extend into 2019.
For 2018, expected growth was mostly revised up in the world’s two main economic areas, the US and the Eurozone. Noticeably, for developed economies, growth is thereafter expected to slow down in 2019, as most countries will enter a maturing phase of their expansion. On the other hand, if emerging asia remains by far the fastest growing area, powered by China, one has to look toward recovering economies such as Brazil or South Africa to see significantly positive growth revisions.
Obviously, IMF growth projections shouldn’t be taken for more than what they are: forecasts, based on currently available concrete data. Many elements could derail this quite rosy scenario, starting with the implementation of trade barriers. The baseline for the IMF’s projection is a continuation of the growth of world trade at around 5% per year - any slowdown on that front would certainly weigh on the growth rate of exporting economies.
Global growth set to stabilise close to 4%
Sources : IMF, SYZ Asset Management. Data as at : 8 May 2018
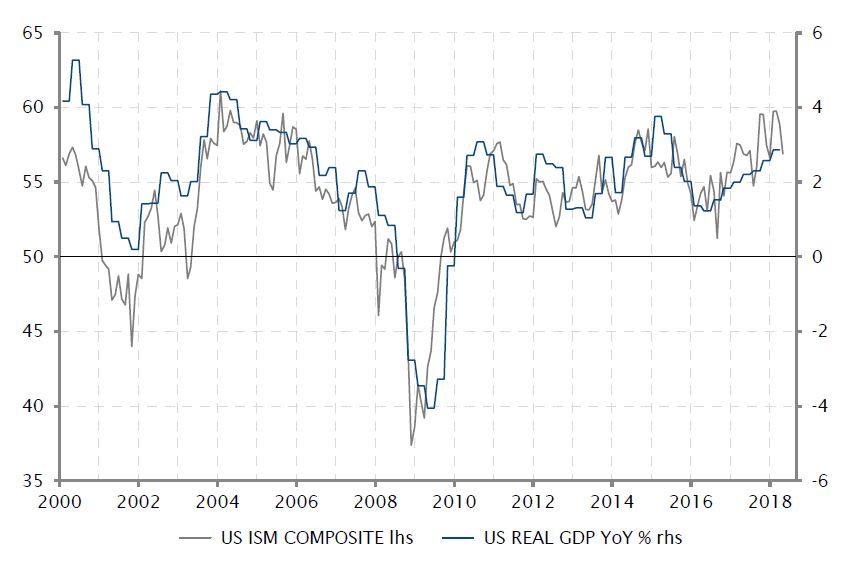
US GDP growth to stabilise in a 2.5%-3% range going forward
Sources : Bloomberg, SYZ Asset Management. Data as at : 8 May 2018
United States - Still on a firm growth dynamic
The 2.3% annualised growth rate of the US economy in Q1 2018 may look a little bit disapointing after the 3% expansion experienced since spring last year. However, positive business investment dynamics and resilience in consumer spending ensured the US economy kept growing above its potential rate.
The US economy has been on an improving trajectory over the past two years. The recovery of business investment, after the energy-led collapse, and continuing growth in household consumption supported by low unemployment, (mildly) rising wages and (still) accommodative credit conditions have driven the year-on-year GDP growth rate toward 3%.
In 2018, business investment is likely to keep benefitting from the tax incentives approved at the end of last year. But the lack of significant improvement in households’ real income and gradually less accommodative credit conditions curbing credit growth are likely to cap the potential acceleration of US GDP growth. A stabilisation at the current (already quite firm) growth level appears likely, as also suggested by the recent plateauing of business activity indices such as ISM surveys.
Eurozone - The ECB cools down monetary policy normalization expectations
If no major monetary policy announcement was expected from April’s ECB meeting, a hint on the central bank’s interpretation of recent economic data was eagerly awaited after several ECB Board members had expressed growing confidence in the possibility (or necessity) to move forward on policy normalisation.
The economic growth slowdown of Q1 was not enough to trigger meaningful changes in the ECB’s formal statement but Mario Draghi quite clearly conveyed a sense of caution warranted by the recent economic developments. The ECB’s president emphasised more downside risks to the outlook. He also denied any discussion around the monetary policy outlook, putting off speculation around the end of QE and start of rate hikes.
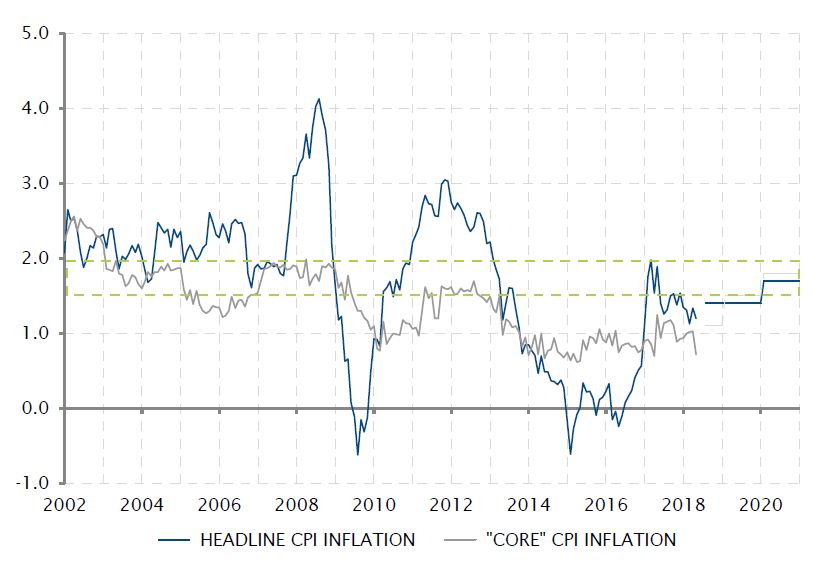
The ECB is logically looking to keep its options open. The central scenario is still one where growth stabilises around 2% and inflation very gradually moves up toward the ECB target of 1.7%-2.0% by 2020. This would allow the ECB to stop its QE programme by the end of the year and to contemplate a first rate hike sometime in 2019. But risks to this scenario now appear to be on the downside, as shown by the unexpected inflation slowdown in April.
Softer growth and inflation could postpone ECB’s expected policy normalisation
Sources : Factset, ECB, SYZ Asset Management. Data as at : 8 May 2018
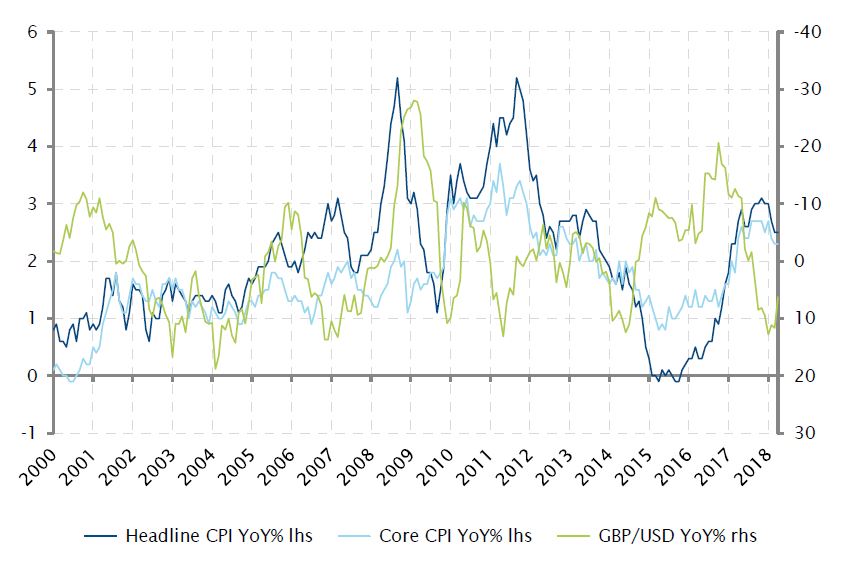
The waning impact of the exchange rate pass through
Sources : Bloomberg, SYZ Asset Management. Data as at : 3 May 2018
UK - Inflation is edging down
UK headline inflation surprised to the downside, decreasing to 2.5% in March from 2.7% in February, below the BoE estimate of 2.8%. The main contributor to the softer data was clothing and footwear, a high import category, which probably suggests that the exchange rate pass through from sterling’s depreciation is fading away.
In June 2016, following the Brexit vote and the collapse of sterling, headline inflation increased from 0.5% to a peak of 3.1% in November last year. If this trend is extended, headline inflation could get closer to the 2% BoE target by year end. The core CPI (excluding food and energy) followed the same path and decreased to 2.3% in March, from a peak of 2.7% in January.
Softer inflation, along with disappointing PMI, has certainly strengthened the dovish camp in the Monetary Policy Committee and postponed the expectation of a rate hike.
Japan - real wage is finally here !
Despite discussion of potential monetary tightening, the BoJ decided to keep a very accommodative stance with no change in its monetary policy. The institution appears powerless in its fight against low inflation as illustrated by the fact that, instead of delaying (once again) the timeframe for achieving its 2% target, it simply decided to drop it.
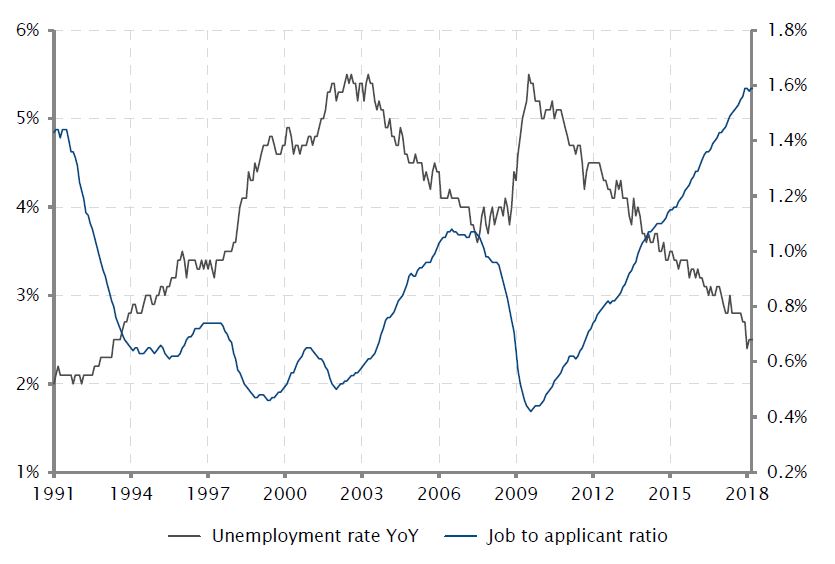
This demonstrates that the Phillips curve concept cannot be applied to Japan. While the job market appears healthy with the unemployment rate at 2.5% and the jobs to applicant ratio at historical highs (158), inflation pressures remain poor so far.
But while real wage growth was negative at the beginning of this year, figures for March seem to finally be signaling an increase that should support consumer spending. A welcome rise given inflation remains muted despite five years of extraordinary monetary easing.
A solid Japanese job market
Sources : Bloomberg, SYZ Asset Management. Data as at : 30 April 2018
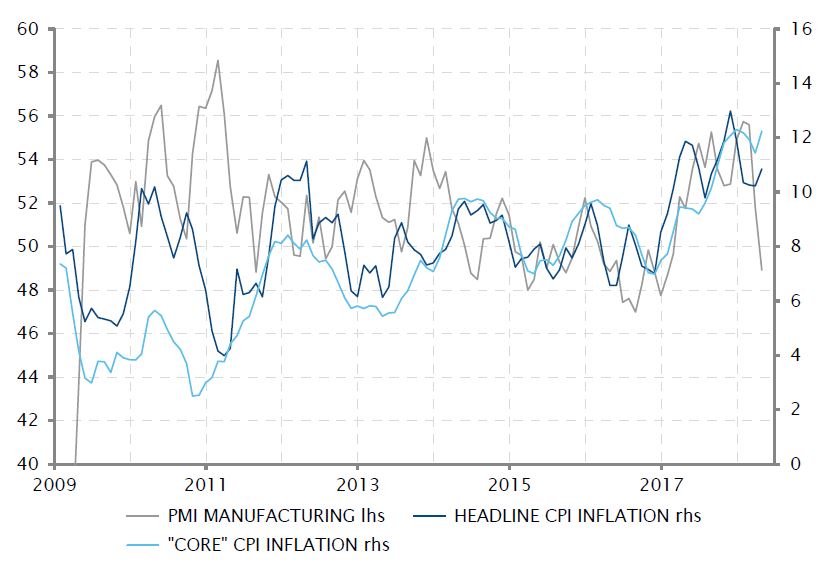
Turkey displays a worrying cocktail of high inflation and slowing growth
Sources : Factset, SYZ Asset Management. Data as at : 8 May 2018
Turkey - From bad to worse
Within the positive current global economic environment, one large economy stands out negatively: Turkey. The world’s 17th largest economy faces a delicate combination of slowing growth, persistently high inflation, deteriorating external imbalances and geopolitical and domestic uncertainties. Little wonder the Turkish lira reached a new low in April.
Turkey has always been sensitive to a strong US dollar and high oil prices, as they exert pressure on its structural current account deficit. Both the Greenback and the barrel are up more than 10% in 2018. Inflation remains stuck in double-digit territory, with little chance of pullback in the near future. The latest PMI manufacturing index has dived to a 15-month low. And US sanctions are about to be reimposed on its Iranian neighbour, complicating an already volatile situation at Turkey’s southern border.
In this context, President Erdogan’s decision to call for early elections on June 24, after having been wary of it previously, can be seen as an attempt to secure a term renewal (including the extended power granted by last year’s referendum) before the Turkey’s economic situation really turns dire. The ongoing lira fall leaves few options for the central bank other than to finally raise rates agressively, which will weigh on domestic consumption. Not a popular economic policy, but the price to pay in order to stem the growing external deficit and avoid a full-blown currency crisis.
USD rates - Don’t worry about the flat yield curve (yet)
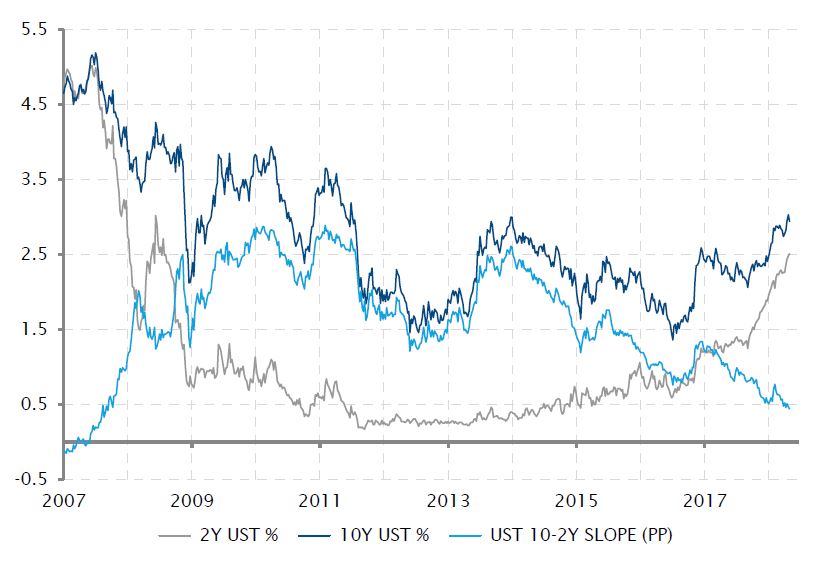
The USD fixed income market has seen the US yield curve reach two symbolic levels in April. The US treasury 10-year rate crossed the 3% level for the first time since 2013 and the US yield curve slope reached its flatest level since 2007.
Those two events are consequences of the ongoing economic and monetary developments at play in the US. A firm economic expansion and a positive upward inflation dynamic are driving nominal bond rates higher - hence the rise of the 10-year rate toward a four-year high. But the impact of this economic backdrop is even more pronounced on shorter-term interest rates, driven by the ongoing rate hike cycle of the Fed - hence the faster rise of the 2-year rate and the yield curve flattening.
Such a pattern is quite usual when an economy reaches the latter part of the expansion cycle. However, it shouldn’t prematurely be interpreted as a recession signal as a very flat yield curve can persist for several quarters: the US yield curve was already flat at the end of 2005, two years ahead of the 2007-8 recession.
US 10-year above 3% and flattest yield curve since 2007 in April
Sources : Factset, SYZ Asset Management. Data as at : 8 May 2018
EUR/USD FX Rate evolution (inverted scale)
Sources : Factset, SYZ Asset Management. Data as at : 9 May 2018
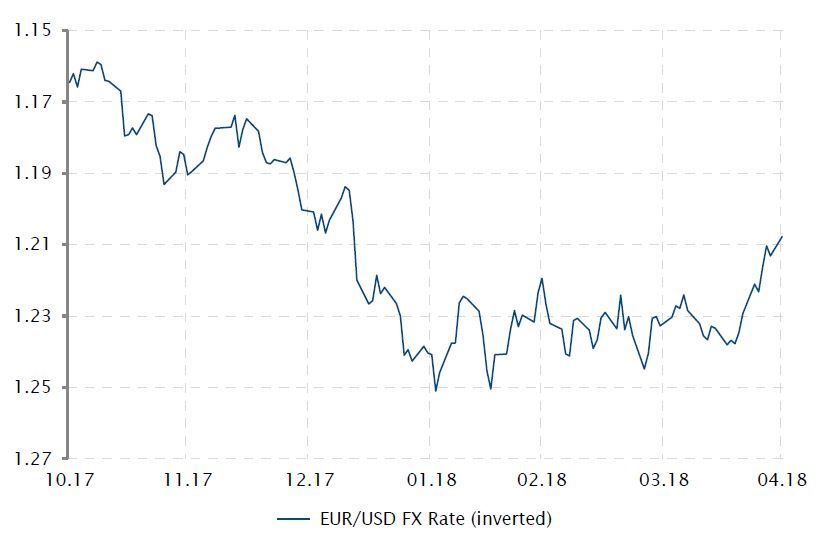
FX - The Greenback is back in April
After three years of US Dollar (USD) strength against the Euro (EUR), last year the Greenback fell -12.4% vs. the Eurozone currency. This trend continued at the beginning of 2018, but in April it started to reverse with the USD being up +2.0% vs. the EUR (while still down -0.6% on a year to date basis).
In the past months, several factors have largely been ignored by the markets (normally in favour of a stronger USD) and are now gaining some momentum, contributing to this April bounce.
On this side of the Atlantic, the ECB remained quite silent (for now) regarding the end of its future monetary policy normalisation, encouraging the Euro’s depreciation. Other developed central banks are seeing downward pressure on their currencies versus the US dollar, as a result of challenging monetary policy conditions.
Moreover, the EUR/USD exchange rate and interest rate differential has been broken and the relationship is starting to normalise again, with higher interest rates in the US being USD positive.
Finally, the political situation coupled with negative structural factors in the US has been well priced into the exchange rate, hence becoming less relevant and releasing pressure on the USD.
Nevertheless, the US Dollar remains expensive on several metrics against the Euro.
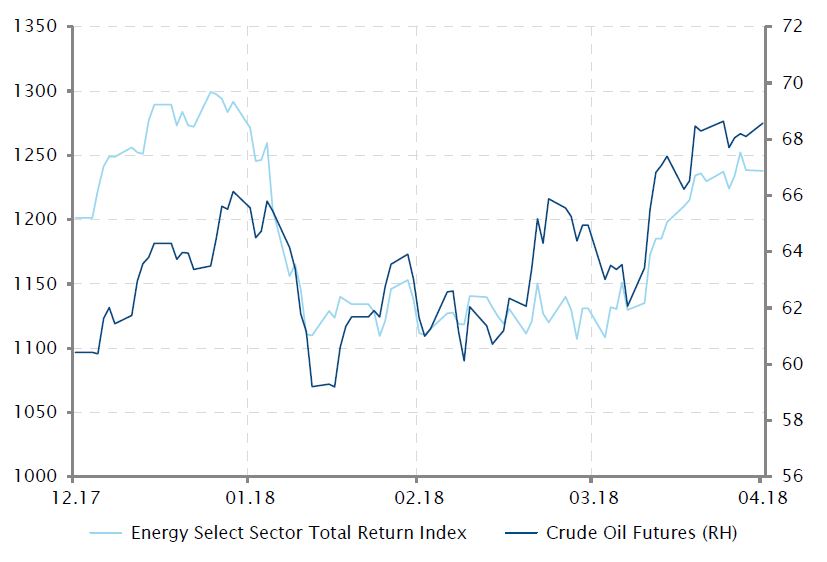
Commodities - The Energy sector posted stellar performance in April
In the US, the energy sector posted stellar performance (+9.3% MTD and +2.1%YTD) during the month of April, becoming the strongest sector and outperforming the second best sector (consumer discretionary) by +7.0% and the S&P 500 by +9.0%.
In parallel, WTI and Brent prices moved respectively higher by +5.7% and +10.0% to reach 69 USD/bbl and 76 USD/bbl. Indeed, oil prices bounced from their 2016 lows of 28 USD/bbl, but are still far away from their 2014 highs of 115 USD/bbl.
On the supply/demand dynamic, oil demand around the world remains strong and at the same time inventory draw could send the oil price higher. Supply falls could come from OPEC countries but also from Iran or Venezuela among others.
On the corporate side in the US, the earnings season has been strong, particularly for energy companies where flows have been increasing in a sector trading well below its cyclically-adjusted price-earnings relative ratio 10-year average. Analysts are also predicting high earnings growth for the next twelve months.
More recently President Trump’s announcement that the US would withdraw from the Iran nuclear deal has also been a positive catalyst for higher oil prices.
US Energy sector and Crude Oil futures evolution YTD
Sources : Bloomberg, SYZ Asset Management. Data as at : 10 May 2018
Russian stock market dropped after US imposed new sanctions against the country
Sources : Bloomberg, SYZ Asset Management. Data as at : 30 April 2018
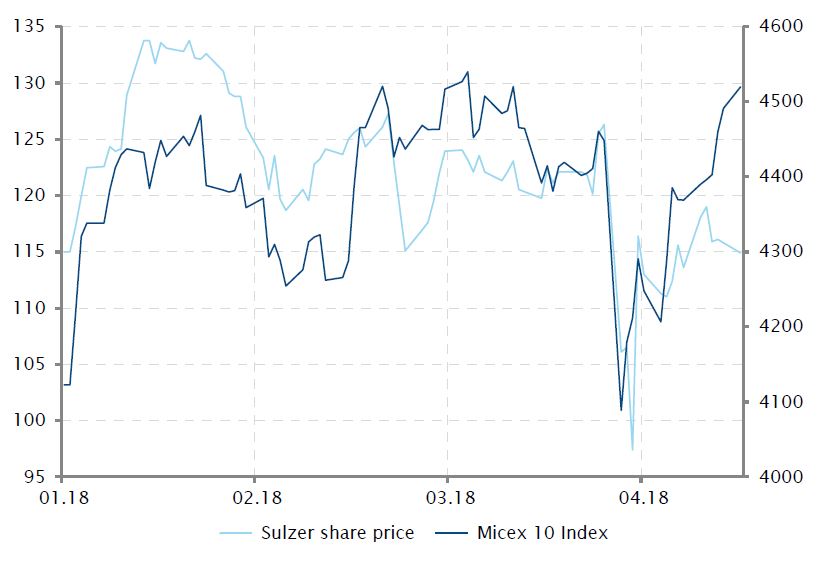
Russia - Stock market hit by US sanctions
Spring was unexpectedly cold for Russian oligarchs, who found their assets and businesses to be under US sanctions in April. Sanctions have become the latest tool used by the US to affirm its superiority. President Donald Trump revealed on 9th April that 24 oligarchs and a number of listed companies were under sanction due to links with the Kremlin.
This round of sanctions had ripple effects in Switzerland as three companies partially controlled by oligarchs have been impacted. Sulzer reacted immediately to dilute the ownership of Renova, a Russian investment group owned by a sanctioned billionaire.
The key to all of this is that the US ultimately controls pretty much of the world’s economy through its currency. If the US Treasury decides that a company is unfit, it can be denied immediate access to worldwide payments in US dollars, jeopardising its operations. A number of Russian-listed companies faced this reality in April.
Disclaimer
This marketing document has been issued by Bank Syz Ltd. It is not intended for distribution to, publication, provision or use by individuals or legal entities that are citizens of or reside in a state, country or jurisdiction in which applicable laws and regulations prohibit its distribution, publication, provision or use. It is not directed to any person or entity to whom it would be illegal to send such marketing material. This document is intended for informational purposes only and should not be construed as an offer, solicitation or recommendation for the subscription, purchase, sale or safekeeping of any security or financial instrument or for the engagement in any other transaction, as the provision of any investment advice or service, or as a contractual document. Nothing in this document constitutes an investment, legal, tax or accounting advice or a representation that any investment or strategy is suitable or appropriate for an investor's particular and individual circumstances, nor does it constitute a personalized investment advice for any investor. This document reflects the information, opinions and comments of Bank Syz Ltd. as of the date of its publication, which are subject to change without notice. The opinions and comments of the authors in this document reflect their current views and may not coincide with those of other Syz Group entities or third parties, which may have reached different conclusions. The market valuations, terms and calculations contained herein are estimates only. The information provided comes from sources deemed reliable, but Bank Syz Ltd. does not guarantee its completeness, accuracy, reliability and actuality. Past performance gives no indication of nor guarantees current or future results. Bank Syz Ltd. accepts no liability for any loss arising from the use of this document. (6)