Equity style premia like Value, Size, and Quality have been identified by numerous empirical studies as persistent, long-term sources of market outperformance. There can be however, periods when the premia are negative.
Value, which has notched a decade-long under-performance, has been the target of critics who proclaim that Value investing is dead. However, this period of underperformance has coincided with an exceptionally long period of accommodative monetary policy and extremely low rates. The desperate search for return has lifted the valuations for all asset classes, including equity, resulting in smaller premia for “cheap” stocks.
Focus
Is value not valuable?
Monday, 12/09/2019Value stocks are suffering from a decade-long underperformance compared to the broader market. Some of the possible explanations behind this lag include the prolonged period of low rates, structural changes and accounting deficiencies leading to the misidentification of Value stocks. But whether you believe that Value is dead or that it is geared for a comeback, it is advisable to diversify across style premia and not to avoid any one of them.

Juliana Auger
Investment Specialist
“All risky assets can be expected to go through long periods of underperformance.”
Relative performance to MSCI World Net Total Return USD Index
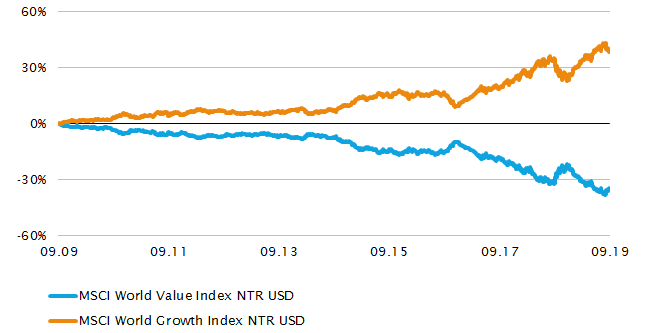
Source
Source: Bloomberg. Data from 30.09.2009 to 30.09.2019.
The Federal Reserve started easing in 2008 and the reserve rate was at 0% between 2008 and 2015 before the first raise in nearly a decade in December 2017 (with cuts restarting in August 2019). The ECB began lowering rates in 2012 and have yet to reverse course. This summer, when sentiment turned risk-off as recession fears invaded markets, the Bund hit new record low yields (around -0.70%). Since then, government bond yields have rebounded but some $12 trillion of debt are still presently yielding less than zero.
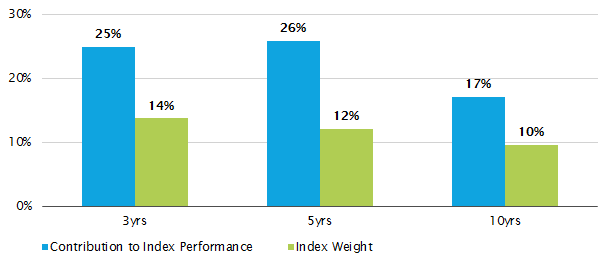
Additionally, an environment where rates are falling and inflation is low is theoretically more favourable for long duration assets (those that will deliver profits in the future) than for short duration ones. While traditional companies who are profitable but growing slowly are disadvantaged, high-growth, cash-negative companies are preferred. The high-flying FAANGs (Facebook, Apple, Amazon, Netflix and Google) contributed about 25% of the MSCI USA index’s performance over the last five years.
Performance Contribution of FAANGs to the MSCI USA NTR Index
Source
Source: Bloomberg and MSCI. Data as of 30 September 2019.
In the short term, we can perhaps explain the underperformance of Value by the US-China trade war, which has adversely affected traditionally Value sectors like Industrials, Materials and Retail. There is also the more philosophical view – that old-economy companies are not inexpensive because of statistics, they are cheap because they face long-term secular challenges. For example, the Telecommunications sector in the early 1990s represented nearly 10% of the S&P 500 market capitalization and was bigger than Information Technology. Now, due to a series of technological disruptions, it represents a mere 2% and has been removed as a major GICS sector.
Finally, another potential explanation is that accounting deficiencies are behind the so-called demise of Value investing. The measure most often used to determine Value stocks is the Price to Book Value ratio (P/B). However, this ratio only captures capitalized spending for tangible (physical) assets, the traditional example being costs to build a new factory. Expenditures for internally-developed intangible assets like brands, trademarks, licenses, patents, IT systems, human resources, etc. do not flow into book value as these items are expensed. From the mid 1980s on, investments in tangible assets have given way to investments in intangible assets as the corporate business model transformed. Currently, the intangible investment rate of the US corporate sector is roughly twice that of tangible investments and the gap keeps growing (Enache and Srivastava, 2018). Spending on intangibles was more than $2 trillion in absolute terms in 2017 (Lev and Srivastava, 2019).
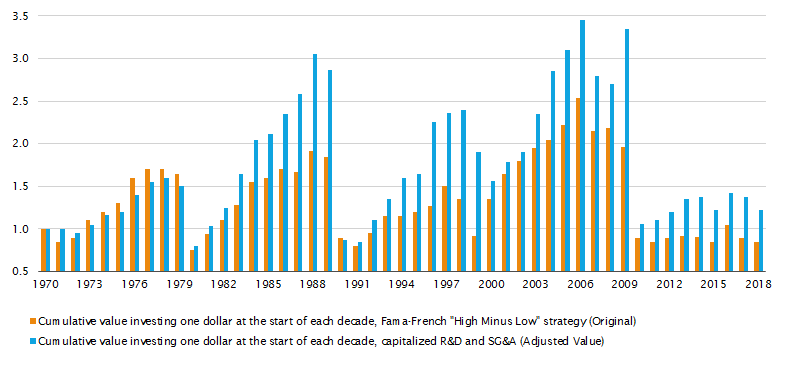
A typical company in the “new” economy may thus appear to be an overvalued due to the understatement of the denominator of its P/B ratio. In reality, its valuation isn’t excessively high when the book value is properly measured. In other words, these companies are improperly tagged as Growth instead of Value. An exercise to reclassify US public companies by capitalizing R&D and a portion of SG&A expenses results in significant improvements in the performance of Value companies as seen in the figure below.
Cumulative Returns of the Original and Adjusted Value Strategy in Each Decade, 1970-2018
Source
Source: Lev and Srivastava, Explaining the Demise of Value Investing, 2019.
Conclusion
The jury is out and to be sure, this period of extra-long outperformance of growth may well be just the result of the fallout from a once-in-a generation global financial crisis; there will be an eventual reversion to the mean. Ten years of little to no Value premium may feel like a long time for investors, but there have been even longer periods where the equity market premium was negative. From Ken French’s (of the Fama and French fame) website, there were three periods that this occurred: the 15 years from 1929 through 1943 (-0.49%), the 16 years from 1966 through 1981 (-0.28%), and the 13 years from 2000 through 2012 (-0.02%). Nevertheless, it would be difficult to find someone in the investment community that has given up on the idea of the equity market premium.
The reality is that all risk assets go through long periods of poor performance. This is a compelling reason to diversify across sources of risk, not to avoid them after periods of poor performance. Long-term investors should look towards multi-factor strategies which provide better risk-adjusted performance than constituent style factors on a stand-alone basis. These strategies provide multiple engines of performance generating better returns, lower volatility and higher Sharpe ratios.
It is fair to say that although the most established style factors are widely accepted as valid – whenever they endure a period of significant underperformance, as with Value, there will always be people who question whether they still work, or if they ever did.
Disclaimer
This marketing document has been issued by Bank Syz Ltd. It is not intended for distribution to, publication, provision or use by individuals or legal entities that are citizens of or reside in a state, country or jurisdiction in which applicable laws and regulations prohibit its distribution, publication, provision or use. It is not directed to any person or entity to whom it would be illegal to send such marketing material. This document is intended for informational purposes only and should not be construed as an offer, solicitation or recommendation for the subscription, purchase, sale or safekeeping of any security or financial instrument or for the engagement in any other transaction, as the provision of any investment advice or service, or as a contractual document. Nothing in this document constitutes an investment, legal, tax or accounting advice or a representation that any investment or strategy is suitable or appropriate for an investor's particular and individual circumstances, nor does it constitute a personalized investment advice for any investor. This document reflects the information, opinions and comments of Bank Syz Ltd. as of the date of its publication, which are subject to change without notice. The opinions and comments of the authors in this document reflect their current views and may not coincide with those of other Syz Group entities or third parties, which may have reached different conclusions. The market valuations, terms and calculations contained herein are estimates only. The information provided comes from sources deemed reliable, but Bank Syz Ltd. does not guarantee its completeness, accuracy, reliability and actuality. Past performance gives no indication of nor guarantees current or future results. Bank Syz Ltd. accepts no liability for any loss arising from the use of this document. (6)