- 1. Global economy – Trade-related uncertainty will continue to weigh on growth
- 2. United States – Dissipating fiscal stimulus weighs on domestic activity
- 3. United States – Industrial weakness
- 4. Rates – German rates fall back into negative territory – below Japanese rates
- 5. China – Weak growth calls for further policy easing


Global economy – Trade-related uncertainty will continue to weigh on growth
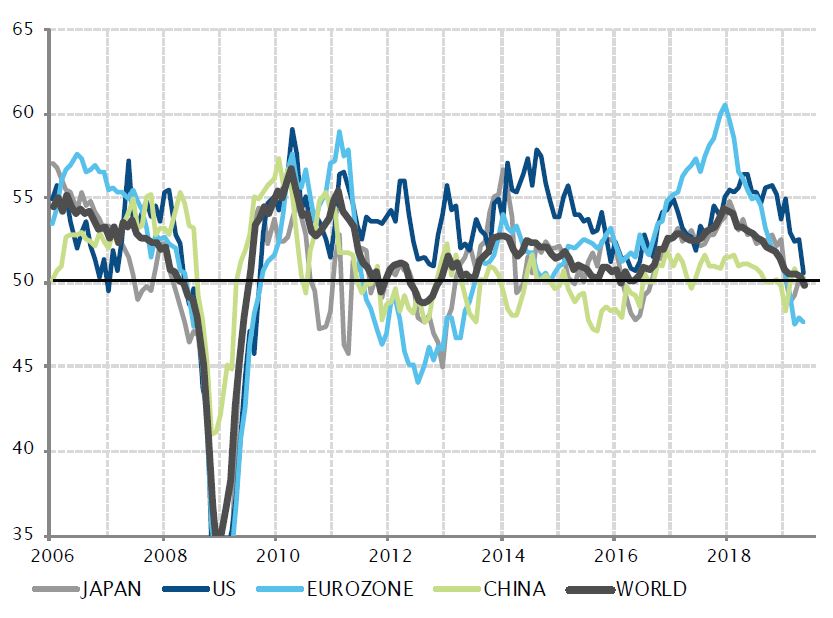
The global growth trend has been slowing since last year. This extended into May, raising concerns around the economic outlook. Activity indices in the manufacturing sector failed to rebound meaningfully from low levels in the areas that experienced the most weakness last year – Europe, Japan and China. This indicator also drifted lower in the US, confirming the recent trend of softer growth dynamics in the world’s largest economy. As a result, the global manufacturing index fell below the threshold which separates expansion from contraction, pointing to a broad-based lack of momentum within the cyclical part of the economy.
Global tensions and uncertainties around trade and tariffs are the key cause of this situation. By disrupting established global supply chains, unexpectedly raising input costs for industries, and, more importantly, by creating large uncertainties around the future business environment, trade sanctions and tariffs have been a strong headwind for corporate investment and industrial activity. Given the latest escalation in tensions between the US and China, as well as the possibility of US tariffs on Mexican exports, headwinds to trade and global growth are unlikely to abate anytime soon.
The US joins weak global manufacturing momentum
Sources: Factset, Markit, SYZ Asset Management. Data as at : 10.06.2019
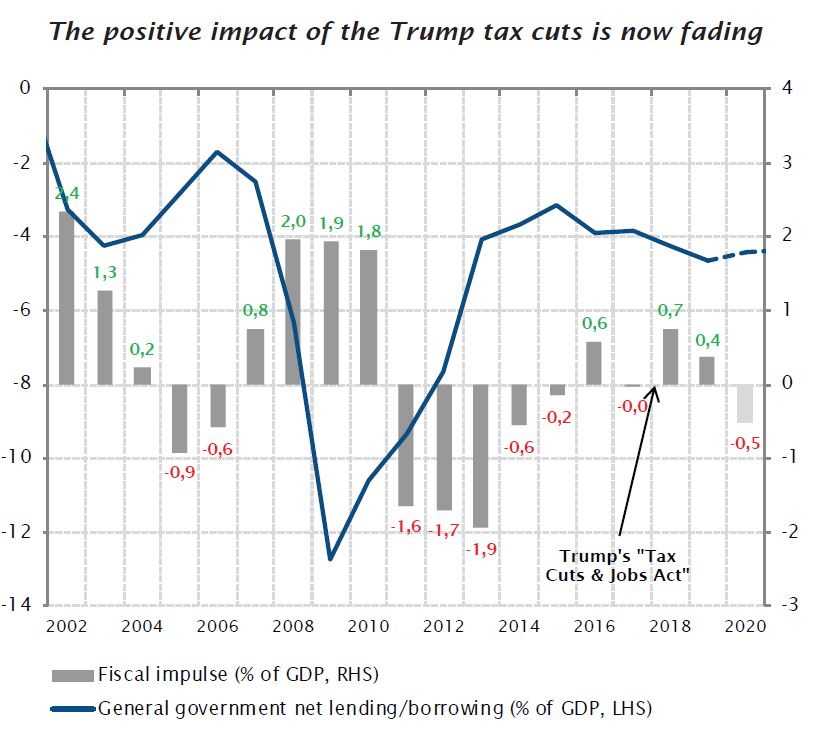
The positive impact of the Trump tax cuts is now fading
Sources : IMF, SYZ Asset Management. Data as at : 10.06.2019
United States – Dissipating fiscal stimulus weighs on domestic activity
After a buoyant 2018, the US economy has experienced a slowdown in 2019. The IMF recently revised lower its growth forecast for the year to 2.3%, and to 1.9% for 2020, after projecting a 2.9% increase in 2019 last year. After a surprisingly strong Q1, various ‘real-time’ indicators of GDP growth point to softer expansion for the second quarter, between 1% and 1.5% annualised growth. Although external factors such as tariffs and trade uncertainties have had a negative impact, they are not the only factors to blame.
Domestic fiscal policy is also having an adverse impact on growth, or more precisely, a less positive impact compared with last year. The impetus provided by Trump’s ‘Tax Cuts and Jobs Act’ boosted GDP growth last year by about 0.7%, contributing to growth above long-term potential – at about 2%.
But the impact of these tax cuts is dissipating over time. It is estimated to represent 0.4% this year, and, if no new legislation is enacted, it may become a negative contributor to GDP growth in 2020, as the government budget balance stabilises at about -4.5% of GDP.
Independently of tariffs and trade tensions, the US economy was bound to slow down this year, and it can hardly accelerate without another round of fiscal stimulus and a widening public deficit.
United States – Industrial weakness
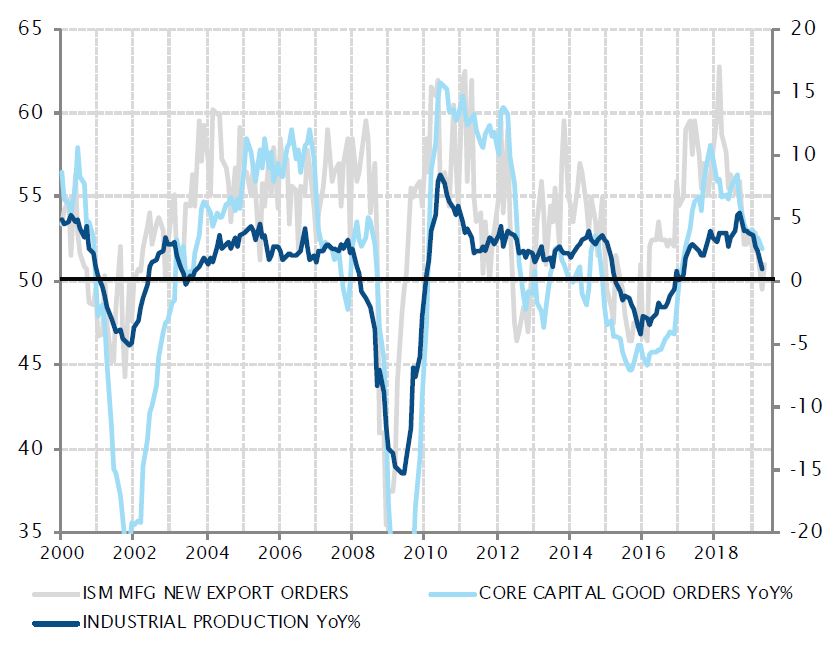
A combination of external factors and internal developments has exerted significant pressure on the US industrial sector this year. Industrial production is down 1.2% from the beginning of the year, and barely up from a year ago.
Several headwinds have converged to dampen activity in the sector. New export orders have stopped growing, affected by slowing global growth, investment, consumption and trade. After the increase in industrial capacity utilisation to a cycle high last year, the fallout of the 2018 tax cut-driven investment spree and softer demand resulted in slowing capex. Job creation in the manufacturing sector has basically ceased.
For the moment, this soft patch appears to be contained within the industrial sector, while activity measures in the service sector continue to point to firm activity, supported by solid domestic demand. However, the longer this industrial ‘air pocket’ lasts, the more it risks impacting the entire US economy, particularly if it affects business and household confidence. In this respect, the evolution of US-China trade talks will be key for sentiment. In the meantime, entertaining the prospect of monetary policy easing is a way for the Federal Reserve to help support confidence.
Industrial activity is slowing in the face of external and domestic headwinds
Sources : Factset, SYZ Asset Management. Data as at : 10.06.2019
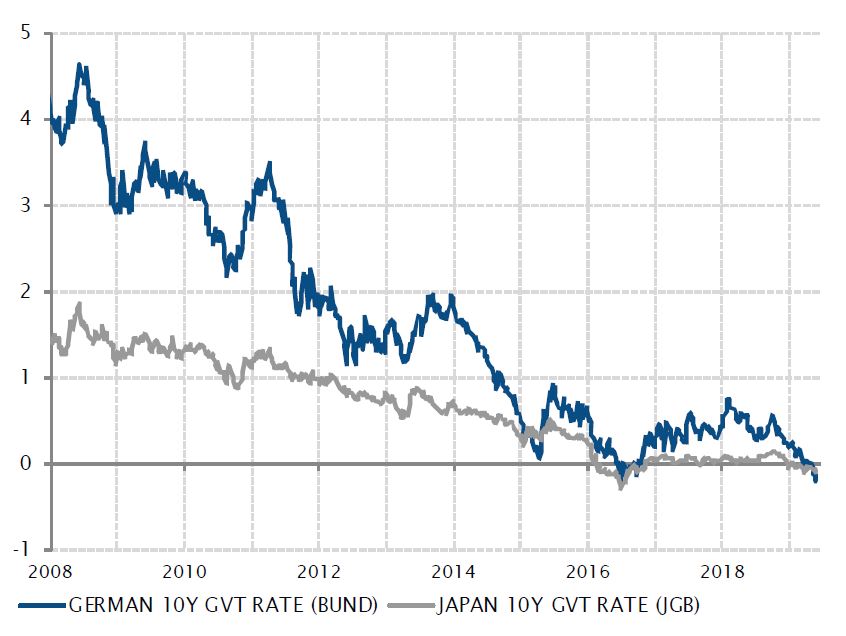
German rates are back in negative territory and below Japanese rates
Sources : Bloomberg, SYZ Asset Management. Data as at : 31.05.2019
Rates – German rates fall back into negative territory – below Japanese rates
Over the past two decades, the European economy has structurally converged towards a Japan-like scenario. Demographic trends, low growth, dampened price pressures, high public debt, unorthodox monetary policies all exhibit striking similarities in Europe and Japan, which, together, make up a quarter of the world’s GDP.
Both the ECB and the BoJ brought key short-term rates into negative territory in 2016. However, in 2017, the eurozone experienced a bout of growth acceleration, fuelling hopes it might reach ‘escape velocity’ i.e. sufficiently firm growth to extract itself from the Japan-style sluggish growth pattern. At the time, this led to a temporary upward repricing of rate expectations, with the ECB openly speaking about monetary policy normalisation, and long-term government rates rising back toward 2015 levels. On the contrary, in Japan, BoJ interventions and the small margin for a revival of inflation and nominal growth kept government long-term rates anchored at about zero.
However, since last year, reality has started gaining the upper hand and euro rates have been converging back toward their Japanese counterparts, along with GDP growth, inflation and monetary policy. Back in negative territory, German 10-year government yields fell below 10-year JGBs in May – at -0.20% compared to -0.09%. This has only happened twice previously, after the ECB QE announcement in 2015 and at the peak of global growth concerns in summer 2016.
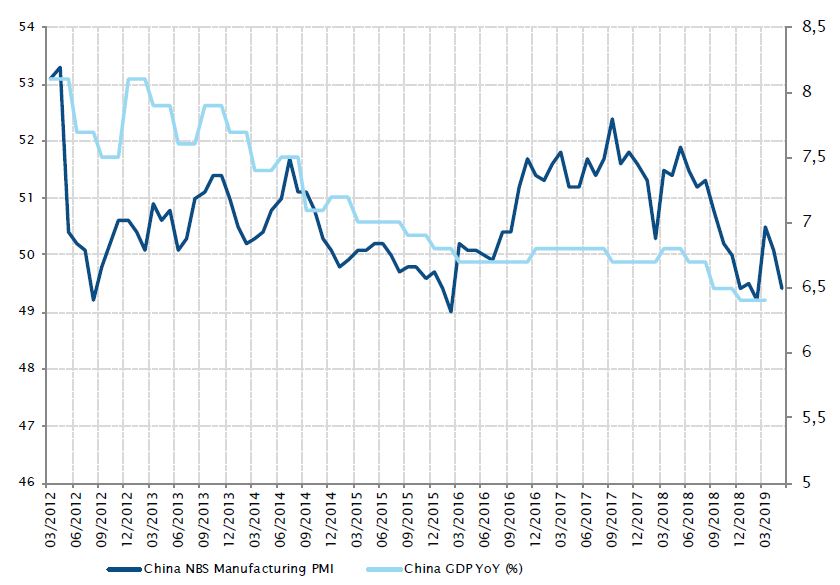
China – Weak growth calls for further policy easing
The China manufacturing PMI entered into contraction territory in May, decreasing from 50.1 to 49.4. The slowdown was mainly driven by weaker global demand, with new orders and new export orders edging lower. This also reflects a more cautious business sentiment on the back of rising trade tensions.
In addition, after a rebound in the first quarter, hard data indicates growth is decelerating. Most indicators – fixed assets investment, industrial production and retail sales – edged lower and fell below expectations over the last two months. Only retail sales bounced in May, partly due to holidays.
Unless trade tensions ease rapidly, Chinese authorities may be forced to ease fiscal and monetary policy further in order to support growth.
Manufacturing PMI fell back into contraction territory
Sources : Bloomberg, SYZ Asset Management. Data as at : 14.06.2019
The last days of May
Sources : Bloomberg, SYZ Asset Management. Data as at : 31.05.2018
The last days of May
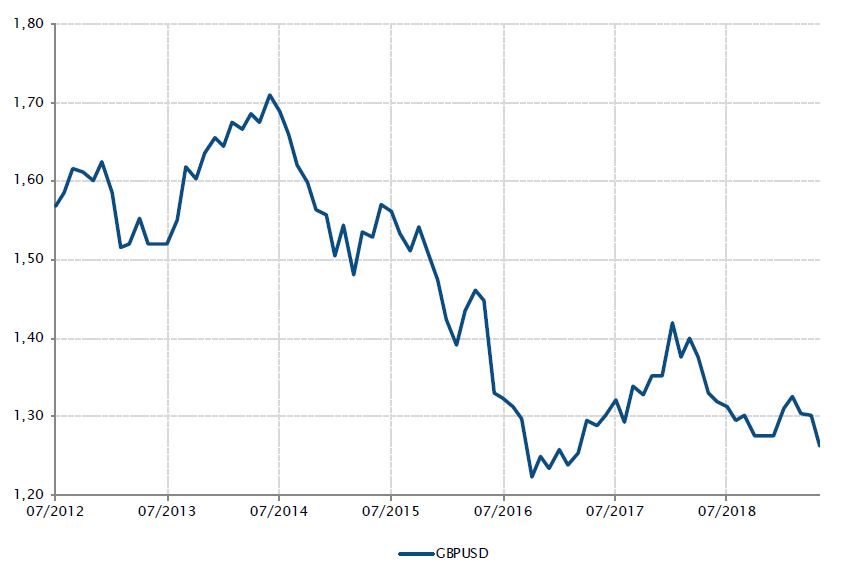
Political risk and uncertainty made a comeback in the not-so-United Kingdom. After another aborted initiative to break the Brexit impasse, Prime Minister Theresa May decided in the last days of May to resign. Odds of a no-deal Brexit rose again, as she will likely be replaced by a Brexiteer. The clock is ticking, with only six months left to resolve the situation.
Sterling was the main victim, falling to 1.26 against the dollar, from a year-to-date high of 1.33 in March. It got dangerously close to its 1.21 low, reached in the months following the 2016 referendum. Despite a resilient growth backdrop, a not-so-dovish central bank, and improvements in the twin deficits, sterling continues to be driven by the Brexit saga.
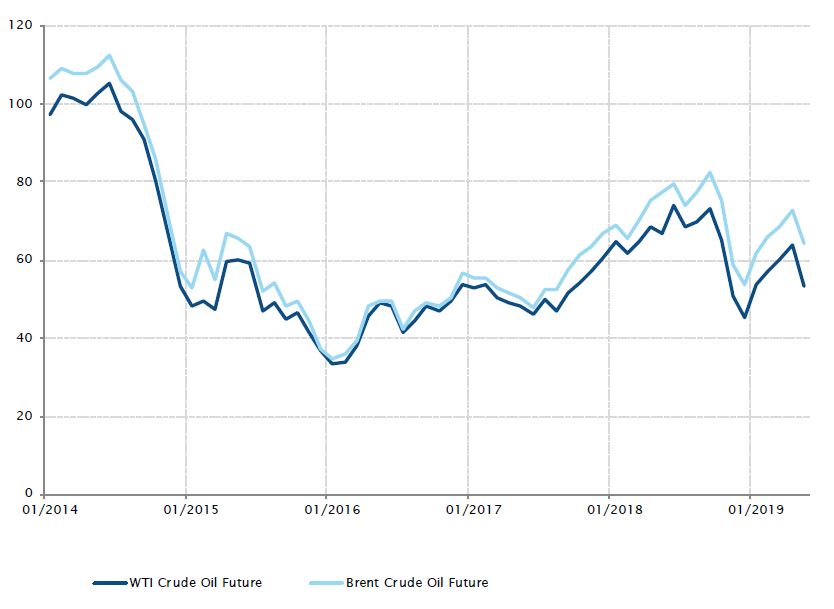
Commodities – Oil sold off on the back of potentially lower growth
After a steady rally this year, oil prices posted their first negative month in May.
Rising tensions between the US and Iran and the sharp fall of Iranian oil exports – following the US decision to not renew waivers – were not able to offset growing global growth concerns which drove energy prices lower.
Market sentiment deteriorated following disappointing macroeconomic data. The global manufacturing PMI continued to edge lower – as the trade dispute between the US and China escalated further. Moreover, the release of strong US oil inventory figures was also bearish for crude.
In this context, oil prices were particularly impacted by the WTI and the Brent dropping by 16.3% and 11.4% respectively across the month.
Oil suffered its first monthly drop this year
Sources : Bloomberg, SYZ Asset Management. Data as at : 31.05.2019
USD/JPY and USD/CHF FX spot evolution
Sources : Bloomberg, SYZ Asset Management. Data as at : 17.06.2019
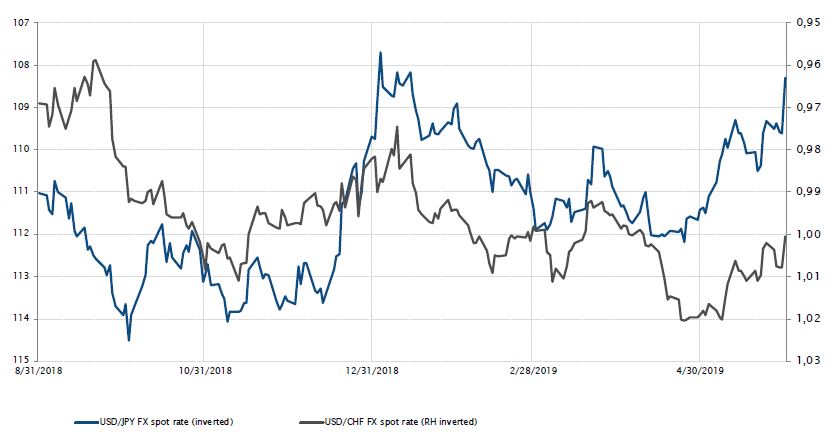
FX – Japanese yen and Swiss franc regain safe haven status
The bullish trend for risky assets, which started at the beginning of 2019, reversed as the trade war jumped back into the spotlight, with most equity markets and all sectors ending the month of May in negative territory.
On the other hand, dovish central banks have contributed to the rally in risk-off assets in government bonds, gold and currencies such as the Swiss Franc and the Japanese yen. These currencies regained their safe haven status and were up 1.8% and 2.9% against the US dollar in a low volatility environment for FX markets.
In a context where markets are now pricing interest rate cuts in the US and questions about weakening global growth are increasing probabilities for a potential recession, safe haven currencies could continue to shine.
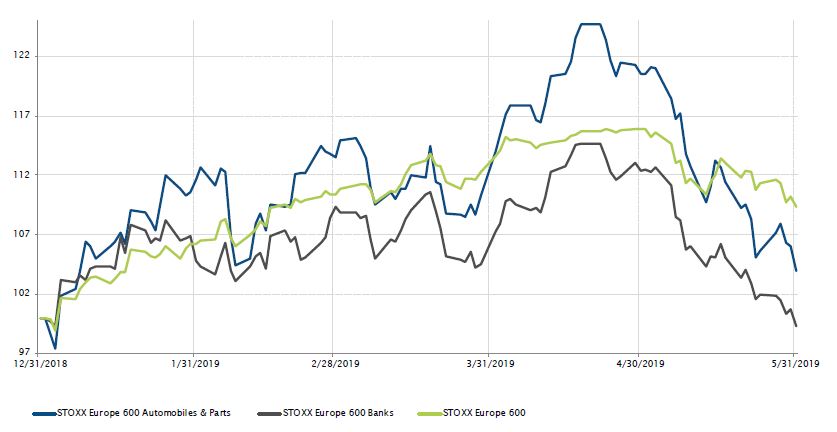
Equities – European automotive and bank sectors underperform
‘Sell in May and go away’ proved true for equity markets, especially for European cyclical sectors and interest-rate sensitive ones such as automotives and banks.
The Stoxx Europe 600 Index ended the month at -5.7% in May, while the automotive and bank sectors were down 13.7% and 11.6% respectively.
As trade war tensions resurface, European autos are not immune. The European car and auto parts sector represents €47bn worth of European exports to the US.
In addition, European banks were also under pressure, as interest rates were lowered in Europe and German bund and French OAT 10-year rates lost 23bps and 16bps. Indeed, European banks generally show a positive correlation to bund yields – when interest rates rise, banks tend to outperform the broad index and when they decrease, banks underperform.
European automobiles and parts, banks and broad index YTD evolution
Sources : Bloomberg, SYZ Asset Management. Data as at : 17.06.2019
Political uncertainties translate into market volatility
Sources : Bloomberg, SYZ Asset Management. Data as at : 31.05.2019
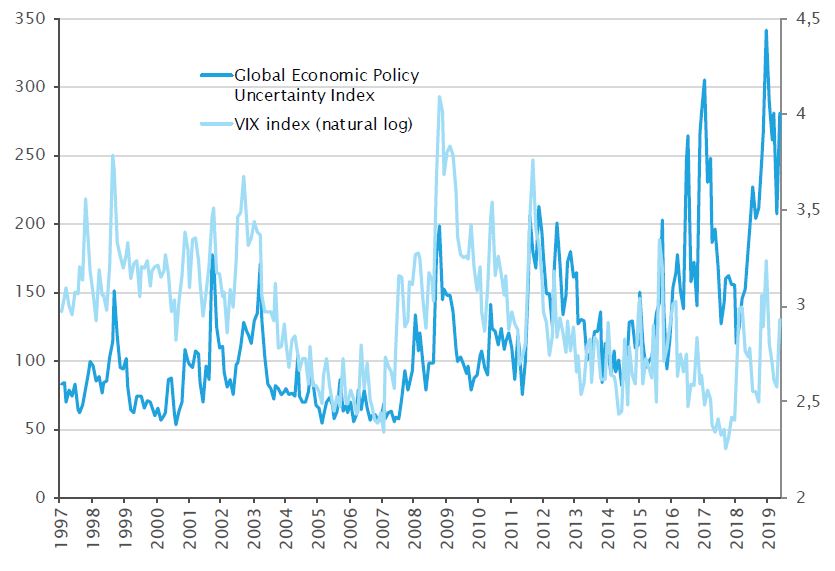
Political uncertainties translate into market volatility
Trump’s tweet at beginning of May, regarding an increase in trade tariffs with China, magnified concerns about continuing sluggish growth. The trade war is acting as a drag on sentiment, which may filter down to the economy through lower investment, production and consumption – especially given current lacklustre dynamics. So far, the dispute has essentially been limited to the US and China, but retaliation seems likely to be extended in the coming months to other goods, services or geographical areas such as Europe and Japan.
As a result, equity markets fell in May – the MSCI world l.c. was down 6% – and the VIX jumped from 13 to 19 on the back of this toxic mix of growth disappointment and trade war uncertainties. The situation is reminiscent of 2003, when geopolitical uncertainties before the Iraq invasion drove equity markets and rates down.
Disclaimer
This marketing document has been issued by Bank Syz Ltd. It is not intended for distribution to, publication, provision or use by individuals or legal entities that are citizens of or reside in a state, country or jurisdiction in which applicable laws and regulations prohibit its distribution, publication, provision or use. It is not directed to any person or entity to whom it would be illegal to send such marketing material. This document is intended for informational purposes only and should not be construed as an offer, solicitation or recommendation for the subscription, purchase, sale or safekeeping of any security or financial instrument or for the engagement in any other transaction, as the provision of any investment advice or service, or as a contractual document. Nothing in this document constitutes an investment, legal, tax or accounting advice or a representation that any investment or strategy is suitable or appropriate for an investor's particular and individual circumstances, nor does it constitute a personalized investment advice for any investor. This document reflects the information, opinions and comments of Bank Syz Ltd. as of the date of its publication, which are subject to change without notice. The opinions and comments of the authors in this document reflect their current views and may not coincide with those of other Syz Group entities or third parties, which may have reached different conclusions. The market valuations, terms and calculations contained herein are estimates only. The information provided comes from sources deemed reliable, but Bank Syz Ltd. does not guarantee its completeness, accuracy, reliability and actuality. Past performance gives no indication of nor guarantees current or future results. Bank Syz Ltd. accepts no liability for any loss arising from the use of this document. (6)