- 1. US economy – Back to a ‘normal’ growth rate
- 2. Germany – Too dependent on industrial exports
- 3. China – Rebalancing the economy before trade surplus with the US declines
- 4. Monetary policy – Forget normalisation, central banks are dovish again!
- 5. Fixed Income – Dovish central banks boosting credit markets


US economy – Back to a ‘normal’ growth rate
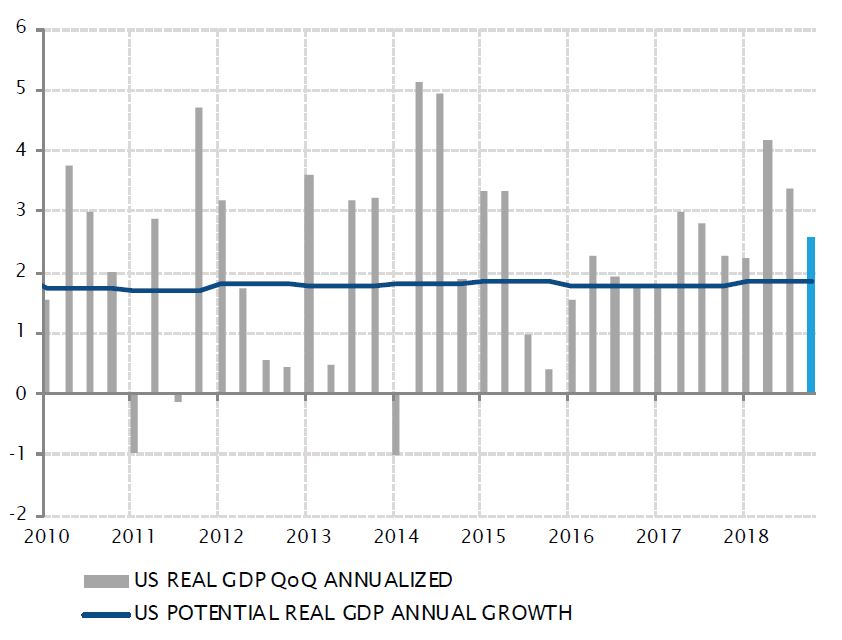
Amid rising concerns around the global growth outlook – and one month later than usual due to the government shutdown – the first estimate of US GDP growth during the fourth quarter of 2018 proved rather reassuring. Household consumption and business investment, the two pillars of US economic growth, both contributed positively to the 2.6% annualised increase in GDP.
Obviously, 2.6% is slower than the 3.4% experienced in Q3, and even less than the 4.2% of Q2. However, this slowing growth trend was to be expected and is not necessarily linked to the more worrying growth softness experienced in Europe and China. The US economy is gradually ‘coming back down to Earth’ after the growth spurt triggered by the Trump tax cuts of early 2018, with a split Congress now preventing the renewal of such fiscal stimulus.
It is fair to say the Federal Reserve rate hikes have dampened consumer credit growth and halted the rise of the residential real estate market. At this stage of the cycle, the risk of a negative economic outcome increases. But one has to keep in mind Q4 was the 11th consecutive quarter of growth above the long-term potential growth rate for the US economy – at about 1.8%. For the moment, this slowdown looks more like a ‘return to normal’ than anything else.
Tax cut impact fades but growth is still above long-term potential
Sources : Factset, SYZ Asset Management. Data as at : 4 March 2019
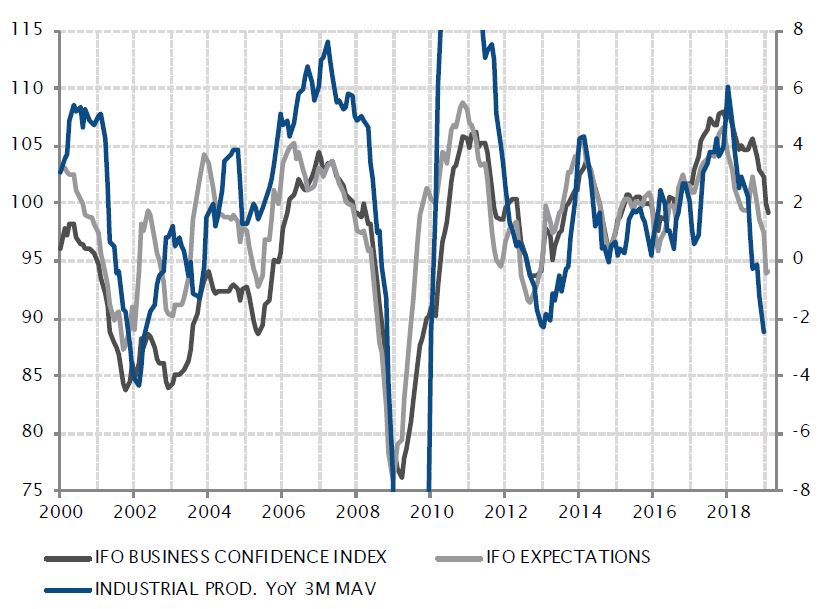
Industrial activity and business confidence has plunged in 2018
Sources : Factset, SYZ Asset Management. Data as at : 4 March 2019
Germany – Too dependent on industrial exports
Is almighty Germany, the economy that outperformed all its European counterparts in the past decade, in fact a colossus with feet of clay? Last year, it experienced one of the weakest growth rates in the eurozone, only second-worst to Italy. Moreover, it narrowly avoided a technical recession – measured by two consecutive quarterly declines in GDP – with a 0.0% GDP change in Q4 following the 0.2% decline in Q3.
The deterioration of activity and sentiment indexes was quite spectacular in Germany last year, especially for those related to the manufacturing and industrial sectors, and business confidence fell to a four-year low. Expectations were down to their lowest level since 2012 at the peak of the European sovereign debt crisis, and industrial production on a 12-month basis also contracted for the first time since then.
This quite abrupt deterioration highlights Germany’s high dependency on exporting industrial goods. With Chinese economic growth slowing, and the US threatening to impose tariffs on European cars, steel and aluminium, German industry has faced strong headwinds in its two largest export markets. While drivers of domestic demand remain supportive and should help soften the blow, the past year bluntly exposes the imbalance of Germany’s growth model.
China – Rebalancing the economy before trade surplus with the US declines
The Chinese economy experienced a pronounced slowdown in 2018, posting its slowest annual growth rate in almost three decades. While headlines centred around the so-called US-China trade war and the imposition of import tariffs, China’s weakening growth is mostly due to lower domestic demand caused by tighter credit conditions.
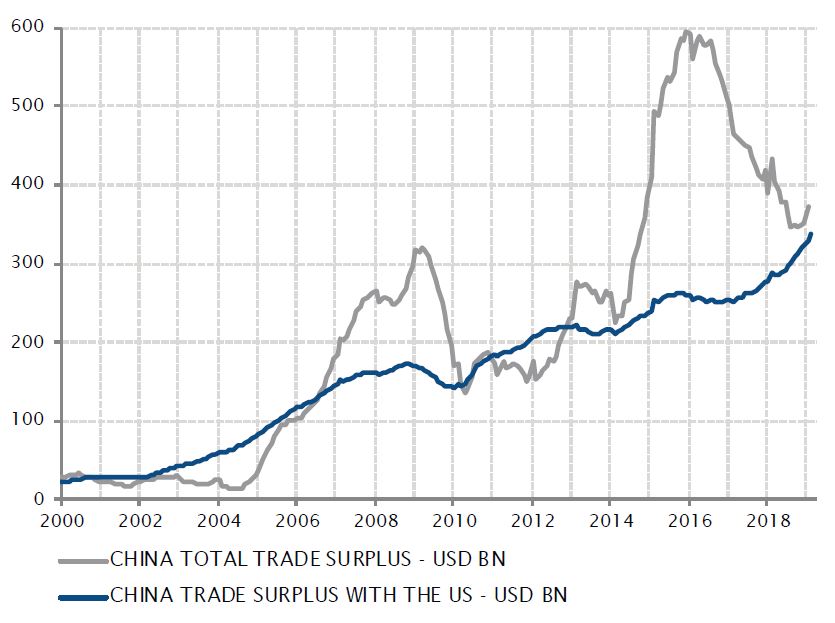
While the overall Chinese trade surplus drifted lower last year, China’s bilateral trade surplus with the US has continued to grow, reaching a record high. The US’ stated intention, which underpins ongoing trade negotiations, is to reduce this dynamic – which would lower the contribution of external trade to Chinese economic growth.
This seemingly unavoidable outcome, the magnitude of which will depend on the result of US-China trade talks, therefore needs to be balanced by a pickup in domestic demand after last year’s sharp deterioration. This is the reason Chinese authorities have embarked on a broad-based easing of domestic economic policies, ranging from more accommodative monetary policy conditions to fiscal support in the form of tax cuts and targeted government spending. Early signs of a pickup in lending and activity suggest these policies may be effective – potentially allowing Chinese GDP growth to settle at 6-6.5% despite the decline in exports.
China’s trade surplus with the US reached a new high in 2018!
Sources : Factset, SYZ Asset Management. Data as at : 4 March 2019
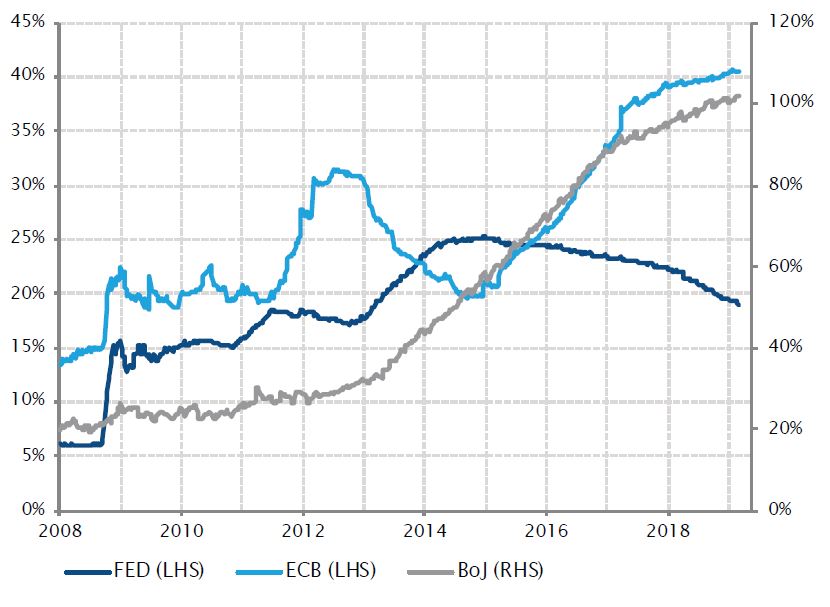
Already the end of attempts to normalise monetary policy?
Sources : Factset, SYZ Asset Management. Data as at : 4 March 2018
Monetary policy – Forget normalisation, central banks are dovish again!
As recently as last summer, the direction of travel for central banks in the main developed economies was quite clear: they were normalising monetary policy, to unwind the unprecedented measures introduced in the post-2008 era. This normalisation was obviously not identical across countries, and was determined by the different characteristics and stages of expansion of each economy.
However, the combination of the growth slowdown, stubbornly low inflation rates, financial market turmoils and looming geopolitical uncertainties – including US-China trade talks, Brexit and European politics – has prompted a brisk shift in central bank attitudes. Any desire for policy normalisation has been put aside and several are now contemplating easing mesures to support economic activity. The Fed has announced a pause – if not a full stop – in its rate hike cycle and is considering halting its balance sheet reduction. The ECB is studying how to prevent the de facto tightening that would occur if existing targeted longer-term refinancing operations (TLTROs) are left to mature without being replaced, and will certainly push forward its guidance on a first rate hike. The BoJ has signalled its readiness to ease monetary policy if necessary and the BoE is now eagerly awaiting some clarity on Brexit before attempting anything. The general trend for monetary policy in developed economies is no longer towards normalisation but rather towards neutrality, with a bias to providing more easing.
Fixed Income – Dovish central banks boosting credit markets
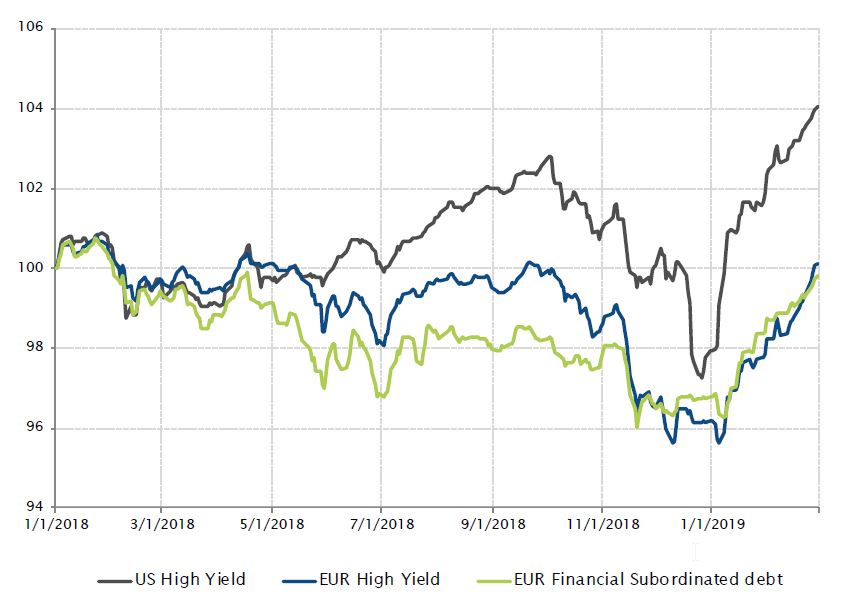
After strong performances in January, credit markets continued to rally in February on the back of spread tightening, especially in the high yield and European financial subordinated debt spaces. The prospect of central banks remaining dovish for an extended period of time boosted riskier assets in the fixed income world.
The Fed mentioned in its minutes it would be patient regarding future adjustments of the federal funds rate, noting a pause in monetary policy normalisation poses few risks for the time being. In Europe, macroeconomic data continued to be disappointing, fuelling expectations for further accommodative monetary policy measures from the ECB, such as a change in forward guidance or the rollover of TLTROs.
The current environment of low interests rates, muted inflationary pressures and accommodative monetary policy is supportive for credit and risky assets overall. In February, the US high yield index gained 1.7% (6.3% YTD), the European high yield index was up 1.9% (4.1% YTD) and the European financial subordinated debt index increased by 1.1% (3.1% YTD).
The rally continues in high yield and European subordinated markets
Sources : Bloomberg, SYZ Asset Management. Data as at : 28 February 2019
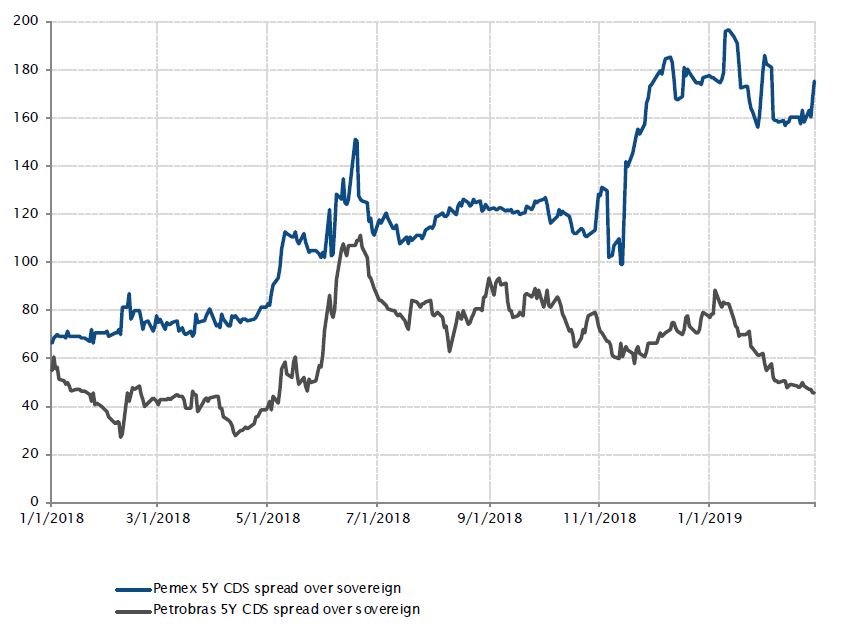
Pemex continues to display a significant spread over Mexico
Sources : Bloomberg, SYZ Asset Management. Data as at : 28 February 2019
Mexico – Government rescue package for Pemex failed to reassure investors
Mexican president AMLO announced on 15 February a $5.2bn plan to support Pemex. The state oil company saw its financial condition deteriorating over the past few years. Its production and cash flow steadily declined, while a large part of its revenue continued to go to the government through royalties, taxes and dividends. This situation, exacerbated by the decline in oil prices, led to structural underinvestment and an increase in leverage. Pemex is the most indebted oil company, with $104bn in debt and $66bn in pension liabilities. Earlier in January, Fitch downgraded Pemex by two notches to BBB- while keeping a negative outlook on the company. Two of the three main rating agencies now rate Pemex just one level above junk status.
The rescue package, combined with weak fourth quarter earnings and further production declines, failed to reassure investors. This was reflected in the spread level; by month end, Pemex 5-year CDS over Mexico sovereigns accounted for 175bps, about four times greater than the 45bps spread investors required for Petrobras against Brazilian debt.
The government is walking a perilous tightrope. On one hand, Pemex might need further measures to prevent a downgrade to high yield and on the other hand, the government must maintain its fiscal pledge to avoid putting the Mexican sovereign rating at risk.
FX – Beginning of the British pound repricing?
In 2019, the British pound, as well as other UK assets including equities and gilts, saw the start of a repricing on the back of improved optimism for Brexit.
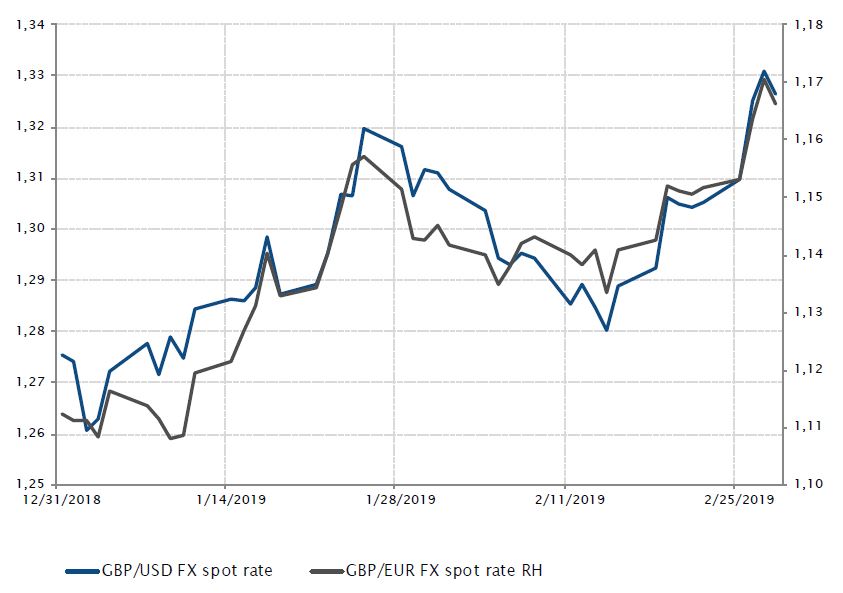
The cable was up against the US dollar and the euro by 4.0% and 4.9% respectively at the end of February, while the FTSE increased by more than 6% and the UK 10-year gilt yield was flat, ending February at 1.30%.
It is well known currency is the first asset class to adjust to a change in an economy’s long-term prospects. From the 10 December 2018 low, when Theresa May decided to delay the UK Parliament’s vote on her Brexit deal by more than a month, sterling resumed its upward trend.
In January, after the UK Parliament voted down the Prime Minister’s deal regarding the terms of the future UK–EU relationship, UK assets, especially the pound, reacted positively. A no-deal or ‘hard Brexit’ outcome would be the worst scenario possible for markets, but seems unlikely.
In this context, a lot of the bad news is already priced into UK equities and sterling, and UK equity valuations remain cheap.
GBP FX Spot Rate evolution against the EUR and the USD
Sources: Bloomberg, SYZ Asset Management. Data as at : 6 March 2019
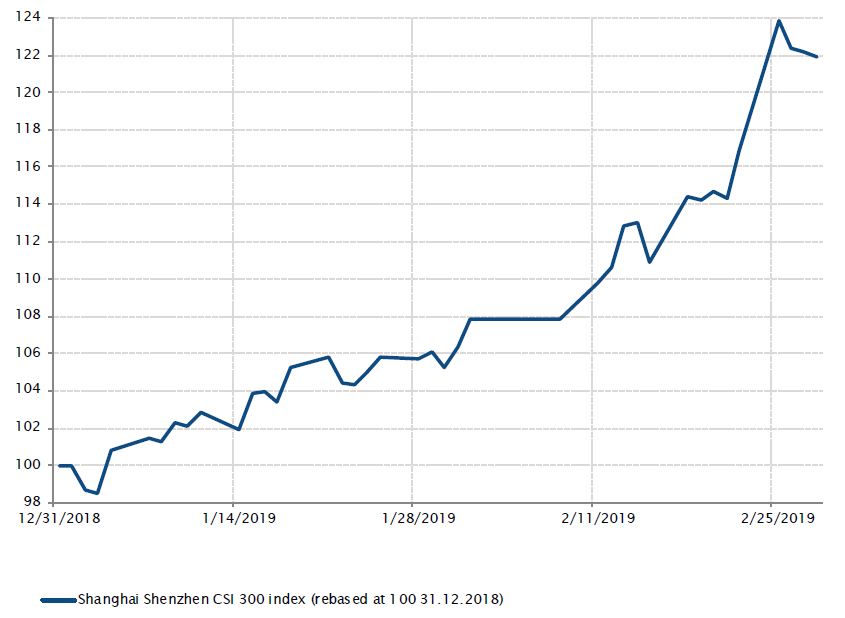
Shanghai Shenzhen CSI 300 index performance
Sources: Bloomberg, SYZ Asset Management. Data as at : 6 March 2019
Equities – Chinese equities’ stellar performance
Chinese equities have been one of the top performers in 2019, with the Shanghai Shenzhen CSI 300 Index’s performance at the end of February above 21%.
Chinese authorities are making it clear they will not let growth decelerate too much further and are putting in place measures to support the economy via monetary and fiscal policies.
Moreover, Chinese equities, on valuation metrics, are scoring very cheap compared to other equity markets, including developed and emerging equities.
On the trade war front, the situation between the US and China has calmed down recently, and one of the biggest beneficiaries of this improvement in sentiment have been Chinese equities. President Trump delaying the tariff increase to 25% on $200bn of Chinese imports was more than welcomed by market participants.
Last but not least, domestic China A-shares were also fuelled by the promise of a greater weighting in MSCI Emerging Markets indices.
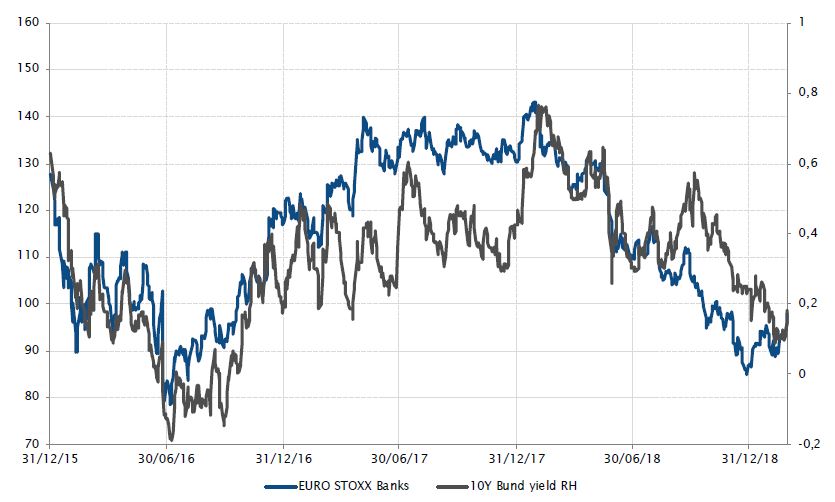
Equities – European banks and the 10-year bund yield correlation
European banks generally have a positive correlation with bund yields. When interest rates increase, banks tend to outperform the broad index and when interest rates decrease, banks underperform.
In the context of ultra accommodative monetary policy in Europe, and with the ECB recently suggesting it will probably err on the dovish side for a bit longer – with a low probability for a rate hike in 2019 – bank profitability remains under pressure.
Since the beginning of January 2018 until February 2019, European banks underperformed the broad European equity index by more than 19%. At the same time, rates rallied, with the 10-year bund yield edging lower, from 0.43% to 0.18%.
Moreover, with a flat yield curve and rates anchored in negative territory – making it difficult for banks to grow their net interest margins – bank earnings have been under pressure, with additionally a lot of non-performing loans sitting on their balance sheets, especially in Italy.
Going forward, we could see a bit of a repricing in European yields, especially German ones. They reached low levels in February, and in the short term, this might play in favour of European banks.
EURO STOXX Banks index evolution and 10-year bund yield
Sources: Bloomberg, SYZ Asset Management. Data as at: 6 March 2019
Gold’s fate is linked to US real rates
Sources: Bloomberg, SYZ Asset Management. Data as at : 6 March 2019
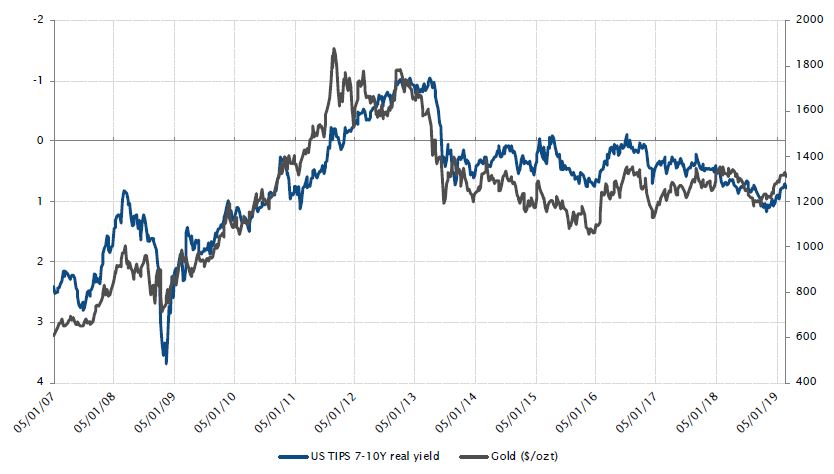
Gold – US real rates drive gold
After an ounce of gold peaked above $1,340 by mid-February, the price finally went south, closing the month flat. The culprit is not a change in investor sentiment, but, as usual, US real interest rates. While gold was the first and main casualty of the 2013 taper tantrum – where it lost more than 25% and was already trading at $1’200 by December – it has benefitted over the last few months, like many other assets, from the reappearance of the Fed put.
The pause in gold’s rally reflects the end of the easy part of the reflation trade experienced by markets over the last two months. From now on, either nominal growth will pick up, leading back to a more hawkish Fed, or it will falter, increasing fears of a recession. In both cases, US real rates seem somewhat capped in the short term, but the former scenario is certainly more supportive for gold – as long as expectations of Fed monetary policy do not adjust as quickly as growth forecasts. The second scenario may at first spell trouble and generate volatility for gold before opening a window of opportunity, as central banks would certainly be forced to adopt zero rates and QE for infinity.
Disclaimer
This marketing document has been issued by Bank Syz Ltd. It is not intended for distribution to, publication, provision or use by individuals or legal entities that are citizens of or reside in a state, country or jurisdiction in which applicable laws and regulations prohibit its distribution, publication, provision or use. It is not directed to any person or entity to whom it would be illegal to send such marketing material. This document is intended for informational purposes only and should not be construed as an offer, solicitation or recommendation for the subscription, purchase, sale or safekeeping of any security or financial instrument or for the engagement in any other transaction, as the provision of any investment advice or service, or as a contractual document. Nothing in this document constitutes an investment, legal, tax or accounting advice or a representation that any investment or strategy is suitable or appropriate for an investor's particular and individual circumstances, nor does it constitute a personalized investment advice for any investor. This document reflects the information, opinions and comments of Bank Syz Ltd. as of the date of its publication, which are subject to change without notice. The opinions and comments of the authors in this document reflect their current views and may not coincide with those of other Syz Group entities or third parties, which may have reached different conclusions. The market valuations, terms and calculations contained herein are estimates only. The information provided comes from sources deemed reliable, but Bank Syz Ltd. does not guarantee its completeness, accuracy, reliability and actuality. Past performance gives no indication of nor guarantees current or future results. Bank Syz Ltd. accepts no liability for any loss arising from the use of this document. (6)