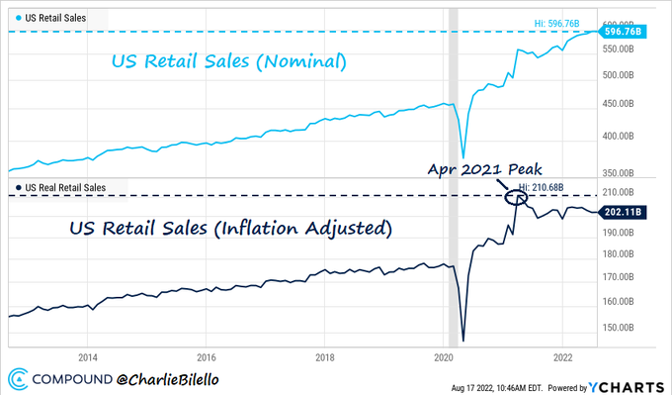
U.S. retail sales surprised on the upside, hitting a new all- time high in July, up 3.6% over the past six months. The picture is very different if one adjusts these numbers with the inflation rate taken into account. Indeed, real retail sales peaked in April 2021 and are down 1.1% over the past six months.
Feature
The week in seven charts
Lundi, 08/22/2022Winter is coming ...
The dollar is the go-to investment for fund managers, and Europe imports natural gas from Australia while it braces itself for the coming winter. Each week, the Syz investment team takes you through the last seven days in seven charts.

Charles-Henry Monchau
Chief Investment officer
Chart #1 — US retail sales in nominal vs. real terms
Source
Charlie Bilello
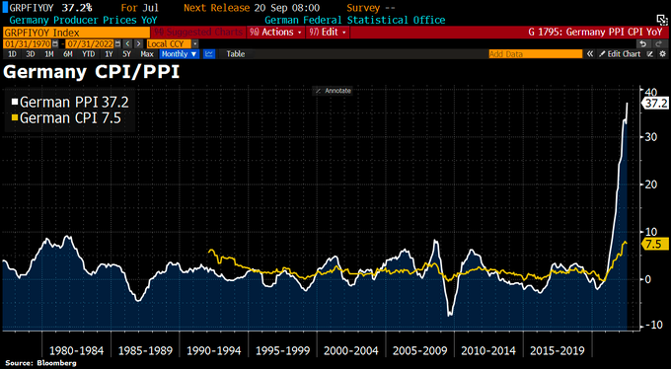
Chart #2 — Producer price index soars in Germany
Is the peak of inflation behind us? Clearly not in Europe! German producer prices rose by 37.2% (month-on-month) in July, a new record. This suggests that the consumer price index has probably not reached its peak and that Germany could suffer the same fate as the UK, i.e. double-digit inflation.
Source
Bloomberg
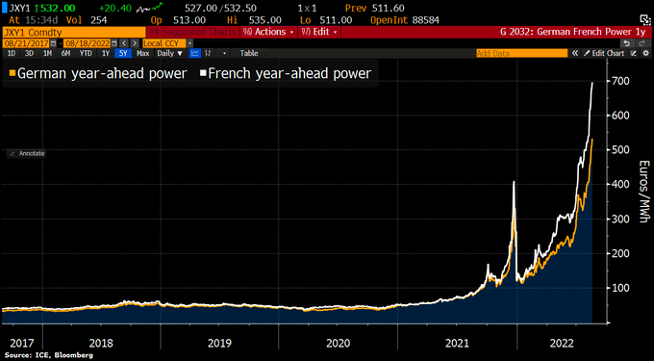
Chart #3 — European electricity prices continue to break new records
Electricity prices in Germany and France continue to rise and reach new records. The one-year electricity contract in Germany has exceeded €500/MWh for the first time in its history. The price of electricity in France for the next year is trading at around €700/MWh... Unless there are significant subsidies, this increase in electricity prices will weigh heavily on the purchasing power and margins of European companies.
Source
Bloomberg
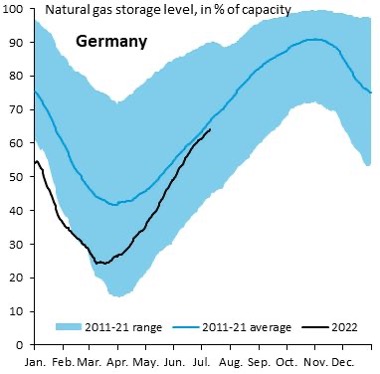
Chart #4 — The level of gas reserves in Germany is a misleading figure
Gas storage levels in Germany usually reach 90% by late autumn; this is the level required for Germany to get through the winter. But this assumption is valid if, and only if, the Nordstream pipeline - which transports imported gas from Russia - is fully operational. But the famous pipeline is currently only operating at 20% of its total capacity. As a result, even with storage levels close to 90 or 95 percent in the coming months, Germany will probably not have enough gas this winter. If Russia reduces supplies, the current storage level will not be able to cover 3 months’ worth of gas needs. Gas rationing this winter is a strong probability.
Source
Robin Brooks
Chart #5 — Liquefied natural gas imported from... Australia
Europe is so desperate for natural gas that it is importing a shipment of liquefied natural gas from Australia (!). This Australian gas has been recharged in Malaysia and will now be shipped to the UK. According to Bloomberg data going back to 2016, Australia has never shipped Liquefied Natural Gas to Europe.

Source
Twitter
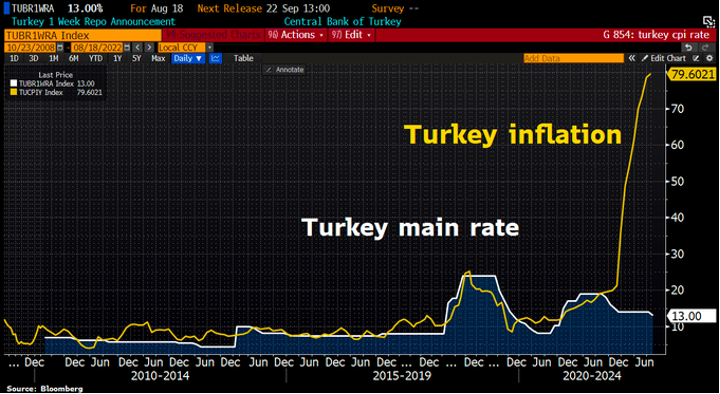
Chart #6 — Turkish National Bank surprises the markets again
Turkey is pursuing an unorthodox monetary policy. Despite inflation being at its highest level in 24 years and the Turkish lira near its lowest levels, it has just decided on an abrupt interest rate cut. The use of monetary stimulus less than a year before the elections reflects the determination of the Turkish authorities to keep Erdogan's promise of further rate cuts, prioritizing growth over price controls.
Source
Bloomberg
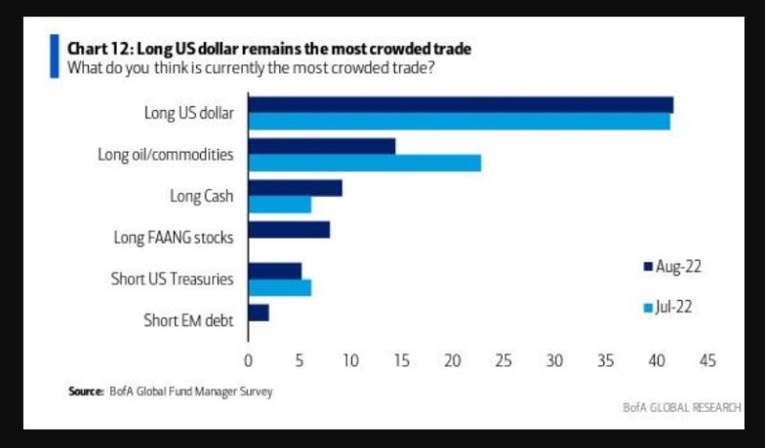
Chart #7 — The dollar is the asset perceived by fund managers as being the most crowded trade
Members of the Federal Reserve have been sending the dollar soaring in the past week with their media appearances. Their message is pretty clear: peak inflation may not be behind us, and the Fed will continue to raise rates. The Bloomberg Dollar Index was up 2% on the week, its biggest weekly gain since April 2020.
An opinion survey of fund managers conducted by BofA on a monthly basis (July in this case) shows that the long US dollar position is currently perceived as the most consensual ("crowded trade"). This is followed by commodities and cash.
Source
BofA Global Fund Manager Survey
Disclaimer
Le présent document a été publié par le Groupe Syz (ci-après dénommé «Syz»). Il n’est pas destiné à être distribué ou utilisé par des personnes physiques ou morales ressortissantes ou résidentes d’un Etat, d’un pays ou d’une juridiction dans lesquels les lois et réglementations en vigueur interdisent sa distribution, sa publication, son émission ou son utilisation. Il appartient aux utilisateurs de vérifier si la Loi les autorise à consulter les informations ci-incluses. Le présent document revêt un caractère purement informatif et ne doit pas être interprété comme une sollicitation ou une offre d’achat ou de vente d’instrument financier quel qu’il soit, ou comme un document contractuel. Les informations qu’il contient ne constituent pas un avis juridique, fiscal ou comptable et peuvent ne pas convenir à tous les investisseurs. Les valorisations de marché, les conditions et les calculs contenus dans le présent document sont des estimations et sont susceptibles de changer sans préavis. Les informations fournies sont réputées fiables. Toutefois, le Groupe Syz ne garantit pas l’exhaustivité ou l’exactitude de ces données. Les performances passées ne sont pas un indicateur des résultats futurs.