Feature

The week in seven charts

Mercredi, 06/15/2022

Will we witness the worst year on record for bonds?

US bonds continue to crumble, inflation is still a major stress, as Chinese equities are showing signs of revival. Each week, the Syz investment team takes you through the last seven days in seven charts.

Mercredi 15/06/2022 - 10:00
Charles-Henry Monchau Chief Investment officer

Chart #1 - US inflation at its highest since 1981

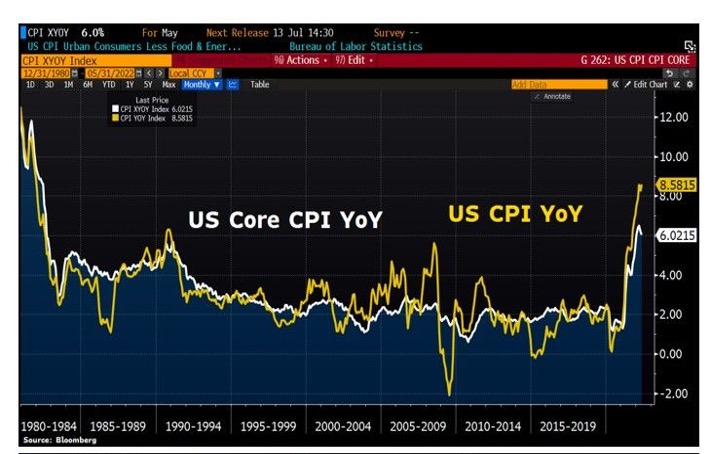
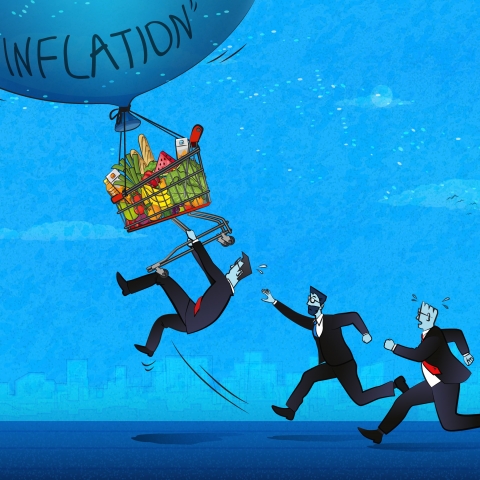
The most anticipated figure of the week was of course the US consumer price index. While the market thought that “peak” inflation was behind us, May's numbers came as a rude awakening. Inflation rose 8.6% year-over-year versus 8.3% expected, the highest since 1981; core inflation (excluding energy and food) rose 6% versus 5.8% expected.

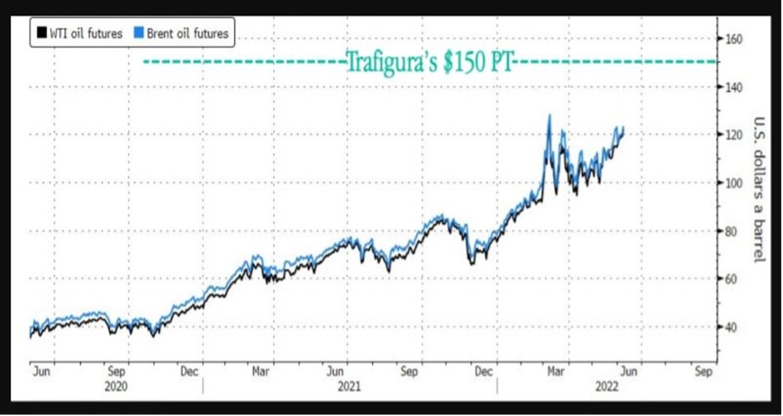
The gap between these two measures of inflation is the widest in 10 years. Headline inflation, driven by rising oil and food prices, has risen considerably in recent months, while core inflation has shown signs of slowing very gradually.


US inflation at its highest since 1981
Source
Bloomberg

Chart #2 - US consumers are feeling the pain

Rising prices are beginning to weigh on household sentiment in the United States. Indeed, the US consumer confidence index as calculated by the University of Michigan is at its lowest level since 1952. This is due to rising consumer prices that are erasing wage growth. Since February 2020, wage growth in the U.S. has reached +11.9% in nominal terms but shows a decline of -0.6% after adjusting for inflation.

US Index of Consumer Sentiment
Source
Charlie Bilello

Chart #3 - 2022 Fed rate hikes expectations are skyrocketing. So is the number of rate cuts in 2023

Expectations for a Fed rate hike in 2022 rose by 30 basis points on Friday, due to a surge in the May inflation figure. At the same time, forecasts for rate cuts after 2022 are also rising, as the market believes the Fed will have to resort to expansionary monetary policy again in order to pull America out of a hypothetical recession in 2023. The market now expects 10 more rate hikes by the end of 2022, followed by three rate cuts.

Rate hikes of 50 basis points for the June and July meetings were anticipated prior to the release of the inflation numbers. The markets now rate a 62% chance of a 0.50% rate hike and a 33% chance that the Fed will act even more aggressively, with a 0.75% rate hike.

2022 Fed rate hikes expectations are skyrocketing. So is the number of rate cuts in 2023
Source
Bloomberg, www.zerohedge.com

Chart #4 - The “dual bear market”

Last week was another bloodbath in the bond markets. In the United States, 2-year bond yields rose on the week by 40 basis points, exceeding the 3.00% threshold for the first time since 2008. Meanwhile, 30-year bonds rose by a mere 10 basis points. The U.S. 5-year to 30-year yield curve inverted for the first time in a month over fears that too much Fed policy could push the U.S. economy into recession.

Despite a good start to the week, stocks are down significantly on a weekly basis (-5.1% for the S&P 500), noting that the main U.S. equity index has declined for 10 of the last 11 weeks, the worst bearish streak since the Great Depression.

This is the fourth worst start to the year in the history of the S&P 500, which has lost 18.2% in the first 111 trading days. At the same time, U.S. bonds are on track to have their worst year since statistics on this market began. The simultaneous decline in the equity and bond markets is making it very difficult for multi-asset managers.

The “dual bear market”
Source
Charlie Bilello

Chart #5 - ECB more hawkish than expected

Key takeaways from last week's European Central Bank (ECB) meeting are the following: 1) A central bank willing to be more restrictive than the market anticipated: the ECB left the door open for a 50 basis point hike in July, flattening the curve as short-term yields rose more than longer-term yields; 2) Inflationary projections increased. The central bank notes that inflation is three quarters dependent on energy but also admits pressure from wage increases; 3) A major omission from the conference: Christine Lagarde made no mention of the creation of a tool to fight against the fragmentation of the bond market in Europe. Indeed, there were market rumors that measures would soon be taken to prevent the spread of yields between German bonds and "peripheral" bonds (Italy, Spain, Portugal, Greece, etc.).

As a result of point number 3, bond yield spreads in the periphery (Italy, Spain, Portugal, etc.) relative to German bond yields widened last week. Greece's 10-year yields reached their highest level since 2018.

Tensions on the bond market had some negative consequences on European equities which broke important support levels last week. Italy, a weak link in European equities, underperformed the rest of Europe with a 5% drop of the index on Friday.

ECB more hawkish than expected

Chart #6 - Trafigura sees $150 for Oil

Oil was down slightly on Friday but remains firm at around $122 for Brent. Earlier in the week, commodity trader Trafigura warned that crude oil prices could reach $150 or more, as a supply-demand imbalance continues to support crude prices.

Trafigura sees $150 for Oil
Source
Bloomberg, www.zerohedge.com

Chart #7 - Light at the end of the tunnel for Chinese equities?

After months of underperformance and a painful bear market, Chinese equities are showing signs of revival. What are the reasons for this?

1. Covid-19 lockdown restrictions are progressively being relaxed;

2. Foreign investors have become more optimistic about Chinese stocks: a net buying flow of 51 billion yuan ($7.6 billion) was recorded from May 27 to June 8;

3. Better news on the macro front. China's exports jumped 16.9% in May from a year earlier. Imports were also higher than expected, rising 4.1% compared to a 2% increase forecast;

4. China is considering reviving the IPO of Ant Group, the Alibaba Group financial company founded by Jack Ma that runs the Alipay mobile payment system. Beijing is reportedly close to issuing a license that will pave the way for the IPO.

Light at the end of the tunnel for Chinese equities?
Source
Bloomberg