

.png)
Story #1: A strong but asymmetrical global economic growth
Global real GDP growth is expected to be around 5.7% in 2021, which would be the highest rate since 1973. While the global recovery is continuing, its momentum has eased and is becoming increasingly imbalanced according to the OECD’s latest Economic Outlook. The inability to ensure rapid and effective vaccination everywhere is proving costly, with uncertainty remaining high due to the continued emergence of new Covid-19 variants. Output in most OECD countries has now surpassed its late-2019 level and is converging on its pre-covid path. However, many developing countries, particularly those where vaccination rates are low, are at risk of being left behind. Employment is still relatively weak in the United States, but is already higher than its pre-pandemic level in the Euro Area and in the UK. At the same time, US GDP has recovered faster than Europe’s. Imbalances also remain across industries, with “reopening” sectors such as tourism, travel and leisure continuing to suffer, while demand for consumer goods has been strong, especially in the US.
Story #2: Global inflation surprised (sharply) on the upside
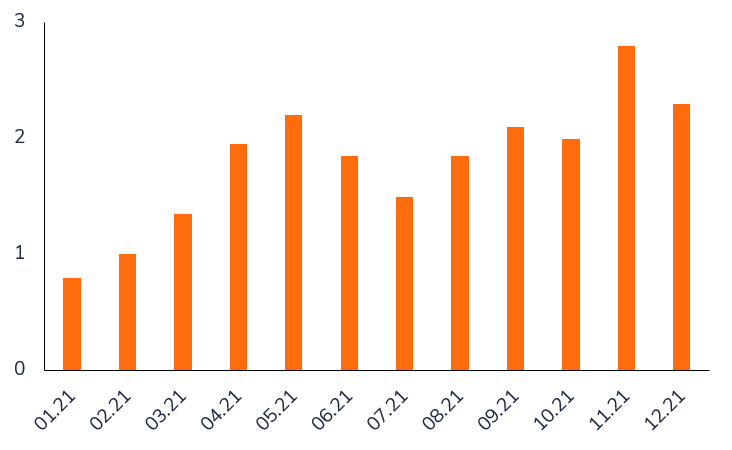
Inflation (and inflation expectations) have significantly increased by the end of 2021 in most countries, to multi-year and sometimes multi-decade highs. The speed of this inflation hike was largely the consequence of three factors. The first one is the fast reopening of the economy. Consumers are buying more and spending some of the savings they have made during the lockdowns. Meanwhile, companies are finding it difficult to keep up with surging demand as they rebuild supply chains, which were badly hit during the pandemic. Issues such as a shortage of container ships and bulk carriers mean transporting goods has become constrained and more expensive. As these challenges persist, companies are passing these costs on to their customers. The second factor is the so-called base effect. To measure inflation, price changes are compared on a year-on-year basis. Prices were exceptionally low at the height of the pandemic last year. As such, comparing today’s higher prices to those very low levels creates large differentials. The third factor is higher energy prices. Oil, gas and electricity have become more expensive around the world. Many factors influence energy prices: droughts in Brazil led to less hydropower, less wind in the UK meant less electricity coming from wind turbines and last year’s cold winter left the US and Europe with lower oil and gas reserves. Lower supply combined with rising demand naturally led prices to rise quickly. As a decent share of companies’ and Citihouseholds’ costs stem from energy consumption, the rising cost of oil, gas and electricity can have a great impact on the overall inflation level: half of the recent increase in inflation was due to higher energy prices.
G10 Inflation Surprise Index
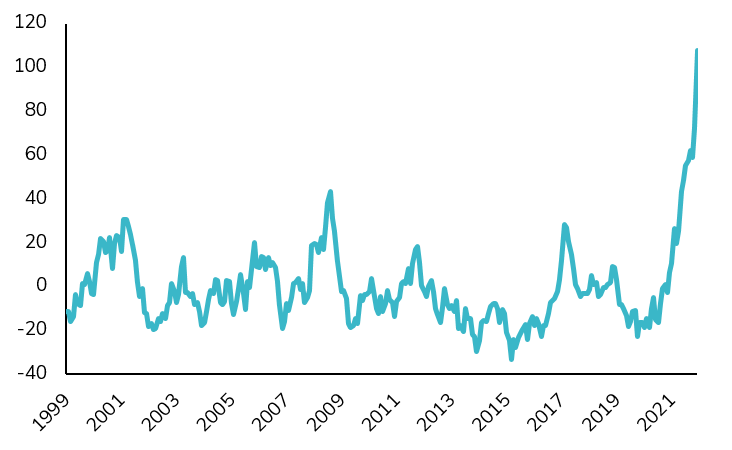
Source: Topdown charts, Datastream, Citi
Story #3: Dovish central banks suppressed volatility in the US and Europe
Central banks in the vast majority of G7 countries remained dovish throughout 2021 despite the strength of the economic recovery and the surge in prices around the globe. Fed Chairman Jerome Powell reiterated on several occasions that inflation was transitory and expected to converge towards the central bank’s target once economic recovery would normalize. In Europe, the ECB also maintained its dovish policy stance. On a combined basis, global central banks added over 2 trillion to their balance sheets in 2021. The Fed purchased another $1.39 trillion in bonds during the year, bringing their total assets up to $8.76 trillion. However, not all central banks refrained to adjust their policy. In Emerging markets, many countries turned hawkish. For instance, Brazil’s central bank increased policy rates by 725 bps throughout the year. Meanwhile, Russia hiked its own by 425 bps. One “special case” was Turkey with an initial hike of 200 bps followed by a 500 bps cut. In December, the tone also turned more hawkish in developed countries. The Bank of England ended quantitative easing and hiked its rates by 15 basis points. The Fed also started to taper its QE program and signalled its intent to hike rates 6 times between 2022 and 2023.
Fed Balance Sheet
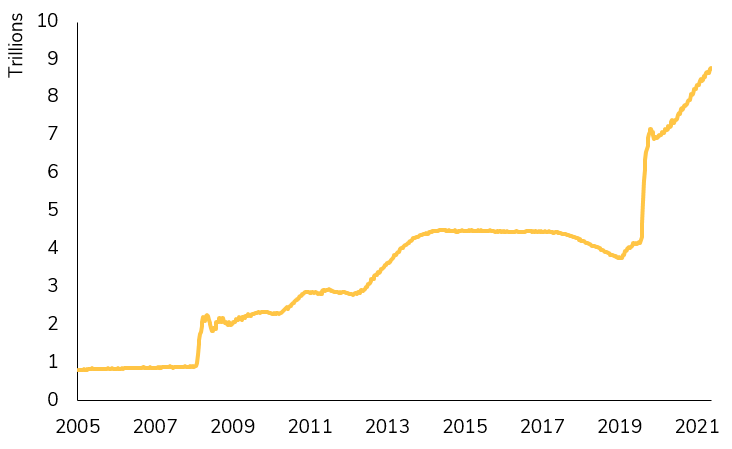
Source: Bloomberg
Story #4: Strong earnings growth
In 2021, one of the key drivers of returns in developed equity markets (see stories #5 and #6) has been the strong earnings momentum and upward revision to estimates. In the US, MSCI 2021e earnings are expected to rise by 51% year-over-year. In Europe, earnings growth is estimated to be 64% according to Refinitiv. Growth is also strong in emerging markets with expectations of 56% earnings growth, although there are major differences among countries. While commodity-exporters such as Brazil (+212%) or Russia (+122%) exhibit very strong earnings recovery, China (+13.5%) lags significantly. We note that the biggest companies in the World have managed to achieve record-high profit margins, despite rising input costs.
Story #5: Commodities and equity markets outperformed bonds
The combined effects of strong global economic recovery, inflationary pressure, record earnings growth and dovish central banks has led to a performance ranking which is highly favorable to risk assets. Indeed, commodities were the best traditional asset class as an aggregated index returned more than 40% in 2021, on the back of strong energy prices (+55% for Crude Oil and +43% for Brent). Other commodities also performed well. For instance, Coffee was up 76%, Lumber 59%, Cotton 44%, Aluminum 42% and Copper 27%. Precious metals sharply underperformed with a -4.1% decline for Gold. The second best performing traditional asset class was equities with a 23% (total return) gain for the MSCI World. US large caps outperformed with a 28.7% gain for the S&P 500 and a 27.4% return for the Nasdaq 100. European stocks advanced by 24% in local currencies. At the asset class level, a major underperformer was Fixed Income, which recorded its worst year since 1999. The US bond market finished down 1.5% in 2021, its first down year since 2013 and only the fourth negative yearly return since inception of the Barclays Aggregate Index in 1976. US TIPS (Treasury Inflation Protected Securities) and US High yield were the only two major segments to generate positive returns for the year.
A bad year for bonds
Annual return of the Barclays Global Aggregate Bond Index (%)
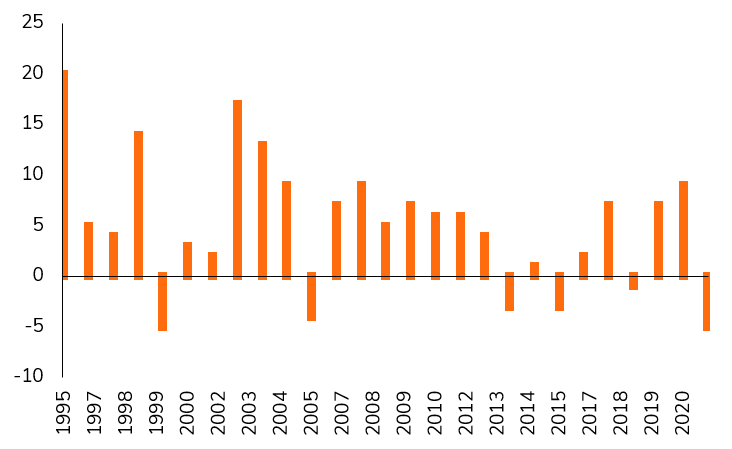
Source: Bloomberg, FT
Story #6: By all accounts a strong year for the S&P 500
The S&P 500 ended the year with a 28.7% gain (total return), its seventh double-digit gain in the last 10 years. It has finished higher than 12 of the last 13 years and 17 of the last 19 years. Over the last 3 years, the S&P 500 has more than doubled-its highest 3-year return since 1997-1999. For the first time ever, all 11 S&P 500 sectors recorded double digits gains. The S&P 500 Energy Index is the year’s biggest winner, advancing 47%. As mentioned earlier, liquidity and earnings growth were two major drivers of 2021’s strong run. Some of the key characteristics of the 2021 bull run for the S&P 500 have been the low volatility but also the limited number and amplitude of pullbacks. Indeed, S&P 500‘s largest pullback in 2021 was just over 5%, much lower than the norm which is rather 10 to 15% on average. On the valuation side, the S&P 500 is getting pricier. While the forward P/E contracted throughout the year, the S&P 500 trades at its most expensive price to sales ratio ever (3.2x). The “Buffett Indicator” (Market Value to GDP) has never been higher as well. Another important development to highlight is the high concentration of the index in a limited number of names due to the long-term outperformance by some mega-caps. In 2021, 35% of the S&P’s return has come from five stocks (Apple, Microsoft, Google, Tesla, Nvidia). Consequently, the top 10 companies´ weight in the S&P 500 is at the highest level since the mid-70s (At the time, the “Nifty Fifty”, a group of large-cap stocks such as McDonald’s, Disney and Polaroid, were prized for their high growth. However, their elevated valuations made them vulnerable to sharp sell-offs and underperformance through the 1980s). Meanwhile, most active managers are struggling to beat the benchmark. In 2021, some 85% of active US stock funds underperformed the S&P 500, in part due to this narrowing market lead.
35% of the S&P 500’s YTD return has come from five stocks
as of 9 December 2021
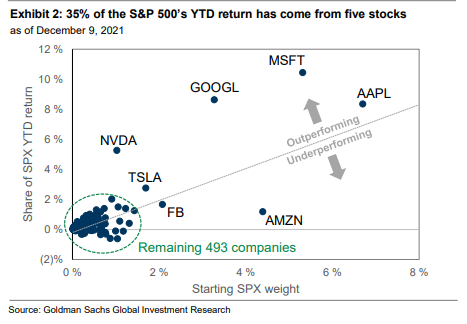
Source: Goldman Sachs Global Investment Research
Story #7: Nascent signs of speculation in the US
One of the big questions for investors is whether we are seeing sufficient exuberance to call a top in the markets. The picture is mixed. For instance, market peaks are often characterized by heavy inflows into equity market funds. Exchange Traded Funds (ETFs) saw strong inflows in 2021, with US ETFs reaching USD 7 trillion, having added USD 2 trillion over the last year. Overall, aggregate equity fund flows however were underwhelming, and money market mutual fund assets remained high as well. Initial Public Offering (IPO) activity, often seen as an indicator of unhealthy speculation, slowed considerably from earlier in the year when the market was fueled by SPACs, or Special Purpose Acquisition Companies. Increased US regulatory scrutiny of these vehicles slowed the number of IPOs. The surge in retail trading was interpreted by many as a sign that the bull market is close to exhaustion. The democratization of online platforms such as Robinhood, and the role played by social media investment platforms such as #WallStreetBets on Reddit, changed the balance of trading volumes between institutional and retail investors. Goldman Sachs, for instance, showed that half of all single stock option trades in the US were placed by retail investors. We should not forget that retail investors’ participation in the bull market between 2008 and 2020 was limited, so some rebalancing was long overdue. There was one paradoxical development which seems to indicate that this market is after all not too “exuberant”: while the S&P 500 is currently at record highs, recent sentiment readings are still relatively bearish. However, this isn’t necessarily negative for markets, as it gives the opportunity for bears to shift their position, which would likely be accompanied by an increase in equity purchases.
AA AI bullish sentiment: 2009 - 2021
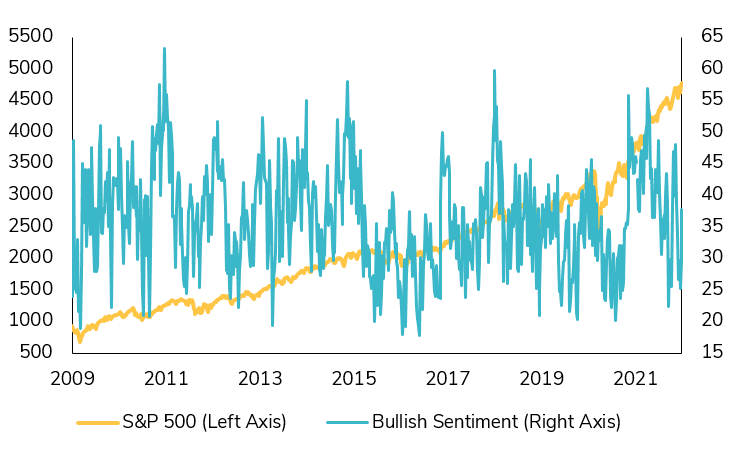
Source: Bloomberg
Story #8: The rising liquidity tide didn’t lift all boats
While 2021 will be remembered as a strong year for large-caps US and European equities, not all stock markets performed well. Even among US equities, some segments of the market strongly underperformed. For instance, US small caps returned only half of the returns of the S&P 500. With a caveat, though. US small-caps value performed strongly, with a 28.3% gain. Meanwhile, US small cap growth had a very tough year – especially the second half – with yearly returns being barely positive (+2.8%). Indeed, some of the darlings of 2020 ended up being the worst performers of 2021. This was the case of high flying names such as Peloton (-75%) or Zillow (-54%), but also many of the stocks held by Cathie Wood’s Ark Invest Innovation ETF, which had lost -38% from its February peak by year-end. As mentioned earlier, emerging markets struggled with a negative performance for the year. Among the worst performers (in US dollar terms), Turkey (-27.5%), China (-21.7%), Chile (-19.7%) and Brazil (-17.3%). There were some strong performers though in the smaller weight index components: UAE returned +44.1%, Saudi Arabia +33.6%, Taiwan +28.9% and Vietnam +22%. Among the larger weightings, India recorded a very decent year (+21.5%).
Emerging vs. Developed Market Equities
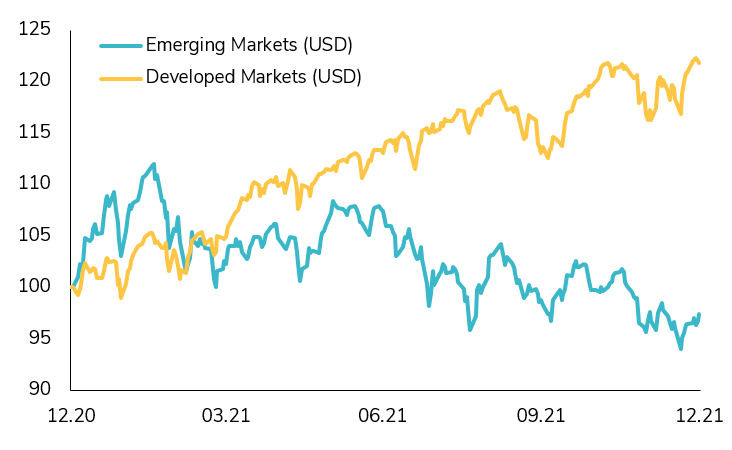
Source: True Insights, investing.com
Story #9: Un-investable China
This year has been unsettling for Chinese equity markets. The economy has been hit by a perfect storm. In the third quarter, official Chinese data revealed that GDP growth stood at 4.9%, down from 7.9% in the previous quarter. Two broad factors have been affecting business activity in China: raw material inflation and low consumer spending. Both have been directly eating into profits of big Chinese companies. Meanwhile, the ruling Communist Party has gone after the private sector industry by industry. Over the summer, China initiated a regulatory crackdown aimed broadly at its internet giants, introducing a series of legislations on issues ranging from anti-monopoly to data security. The moves wiped out billions of dollars in value from the country’s tech titans. But Chinese authorities didn’t limit the regulatory crackdown to technology. After-school tutoring businesses, gaming and property developers were sharply curtailed as well. Evergrande, the country’s biggest property developer, is on the verge of collapse and added more uncertainty to Chinese equity markets, which were among the worst performing ones in 2021. We note that the Hong Kong Hang Seng index currently trades below book value.
Story #10: A year to remember for crypto-assets
Besides the traditional asset classes, 2021 may be remembered as a breakthrough year for cryptocurrencies and digital assets. Indeed, with a return of 66%, Bitcoin topped all major assets for the 3rd straight year. Performance from altcoins such as Polkadot (+188%), Ethereum (+403%), Binance (+1255%), Solana (+11,146%) or Polygon (+14,091%) were even more spectacular. Cryptocurrencies as an asset class moved from less than a trillion dollars in market capitalization to close to 2.5 trillion (with a peak of roughly USD 3 trillion in October). Moreover, blockchain applications such as DeFi (Decentralized Finance), NFTs (Non-Fungible Tokens) and the Metaverse suddenly emerged. Finally, the year was characterized by a broader adoption of cryptocurrencies by the financial industry, with the launch of the first Bitcoin ETF, the IPO of Coinbase, cryptocurrency custody and trading by large banks worldwide. The inclusion of cryptocurrencies in global portfolios is not only of interest to retail investors, high net worth individuals or hedge funds, but also institutions and corporates such as Tesla, Square or MicroStrategy. This took place despite a crash in crypto in May, following by a ban on Chinese miners and threats of tighter regulation worldwide.
Adding $1.5 Trillion
Crypto market cap roughly tripled in 2021, at one point nearing $3 trillion
Source: CoinGecko, Bloomberg