Feature

The week in seven charts

Montag, 09/26/2022

The pound sterling reached its lowest price


A flurry of rate hikes by global central banks, no end in sight for bond market turmoil, while oil stocks tumble.  Each week, the Syz investment team takes you through the last seven days in seven charts. 

Montag 26/09/2022 - 11:20
Charles-Henry Monchau Chief Investment officer

Chart #1 - Nasdaq on track for worst run of negative quarters since the 2008 crisis

Global equities recorded a second consecutive week of declines after the Fed announced a 75 basis points rate hike while suggesting that monetary policy will remain tight in the coming months.

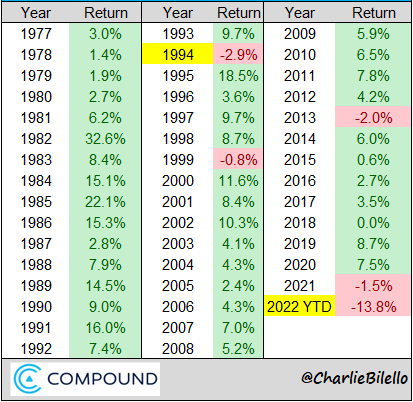
During the session, the Dow Jones Industrial Average reached its lowest level since the end of 2020, while the S&P 500 and Nasdaq Composite are holding mid-June 2022 levels for now. The S&P 500 is now down 22.5% year-to-date, the fifth worst run in history.

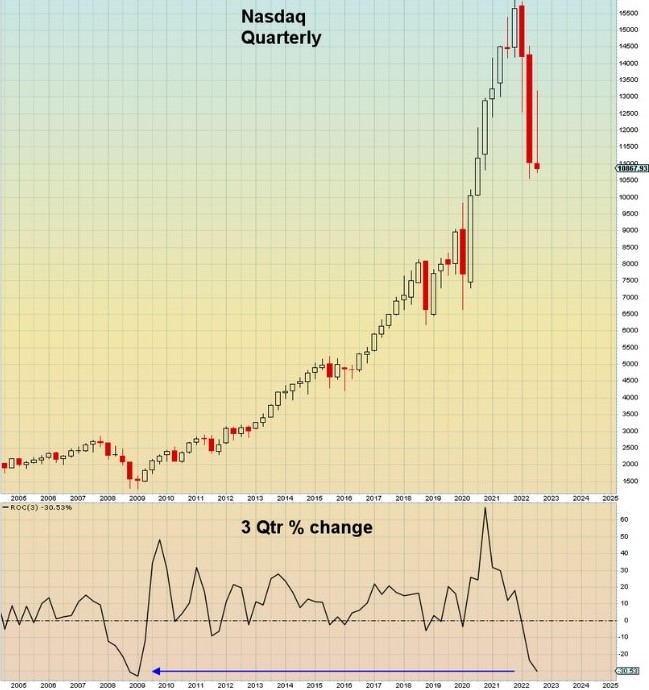
As for the Nasdaq, traders only have a few sessions left to prevent the index from recording its three worst consecutive quarters since 2008.

Nasdaq index with quarterly candlesticks
Quelle
Mac10

Chart #2 - The VIX, or "fear index", is approaching levels which were historically attractive entry points into equity markets

The VIX index, a gauge of market stress, rose sharply at the end of the week and exceeded the 30 level for the first time since June. The index is back in the top decile of historical data. These are the levels that have often provided buying opportunities in the equity markets for investors over time horizons ranging from one to five years.

Performance of the S&P 500 in periods following high VIX levels
performance of the S&P 500 in periods following high VIX levels
Quelle
Charlie Bilello

Chart #3 - Oil stocks tumbled

WTI crude oil fell below $80 last week for the first time since January and is on track to lose all gains from 2022. As a result, the SPDR Oil stocks ETF (XLE), which replicates the US oil stock index, plunged nearly 7% in a single session (Friday), its second biggest daily drop since May.

Daily variations of the XLE ETF (Energy Select Sectors SPDR Fund)
S&P 500 index (in yellow) vs. VIX index (in white)
Quelle
www.zerohedge.com, Bloomberg

Chart #4 - The carnage in the bond markets continues

Last week, the yield on two-year US Treasuries rose above 4.10%, its highest level since October 2007. The 10-year US Treasury yield reached 3.77%, the highest since November 2008. The inversion of the 2-year to 10-year curve has deepened to minus 52 basis points.

The US bond market is on track for its worst year ever, with the Bloomberg US Aggregate Index down 13.8% year-to-date. This is a decline that is out of all proportion to recent history, since the biggest annual decline recorded to date was -2.9% during the 1994 bond crash.

Bloomberg US Aggregate index, Total return 1977 - 2022
Quelle
Charlie Bilello

Chart #5 - A very busy week for central banks

Major central banks stepped up their fight against inflation with a cumulative 350 basis point hike last week. 

On Wednesday, the Federal Reserve raised US rates by three quarters of a percentage point for the third consecutive time, while the British, Swiss and Norwegian central banks all raised rates sharply the following day.

The central banks of the ten major developed economies have raised rates by a total of 1,965 basis points in the current cycle, with Japan being the exception by maintaining an expansionary policy.

It is worth noting that these hikes come at a time when the risk of recession is clearly on the rise.

Central banks are stepping up their fight against inflation

Chart #6 - UK Gilts are crashing

The rise in bond yields is not just happening in the US. In the UK, the biggest tax cut since 1972 caused a mini-bond crash on Friday. Yields on UK government bonds (Gilts) rose by 50 basis points, the largest daily increase on record. The market reacted badly to the newly elected Prime Minister's new fiscal policy ("Trussonomics") by selling off both Gilts and the British Pound. It is very rare that a developed country experiences a simultaneous fall in domestic bonds and its currency.

UK Government bonds 5 year yield
Quelle
Bloomberg

Chart #7 - Pound and other G10 currencies plummet against the dollar

The pound sterling reached its lowest price (against the dollar) in 37 years last week. On Friday alone, it lost up to 3.6% against the greenback. Over the week, the drop was 5%, bringing the pound's devaluation to 27% since the 2016 Brexit vote.

But the British pound was not the G10 currency that depreciated the most last week. Indeed, it was the Swedish krona that posted the biggest weekly decline, even though the Riksbank raised rates by 100 basis points last week, a larger than expected increase. It is clear that we are in a situation of unprecedented dollar strength against the vast majority of currencies.

Performance of G10 currencies against the dollar over the past week
Quelle
Bloomberg