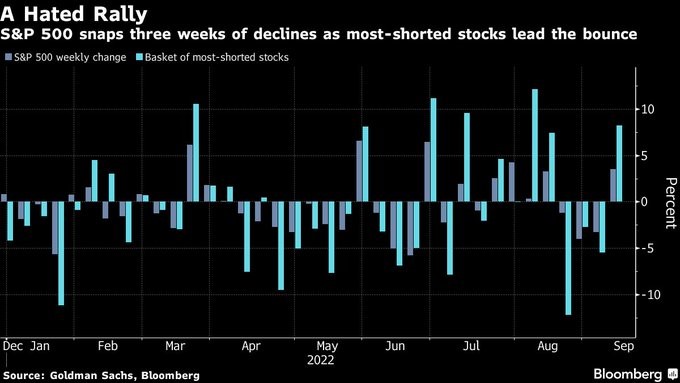
After three consecutive weeks of declines, the S&P 500 rose 3.6% in a week shortened by Labor Day (Monday). The main US equity index closed above the 50- and 100-day moving averages, triggering forced buy back by the shorts. Investors seem to be becoming more optimistic that the central bank can restore price stability without plunging the US economy into recession.
Feature
The week in seven charts
Montag, 09/12/2022Some signs of easing on the US inflation front
Bitcoin mirroring the S&P 500, the ECB raises rates by 75bps, while the strong dollar is costing the rest of the world. Each week, the Syz investment team takes you through the last seven days in seven charts.

Charles-Henry Monchau
Chief Investment officer
Chart #1 - Finally a bullish week for equity markets
Quelle
Bloomberg, Goldman Sachs
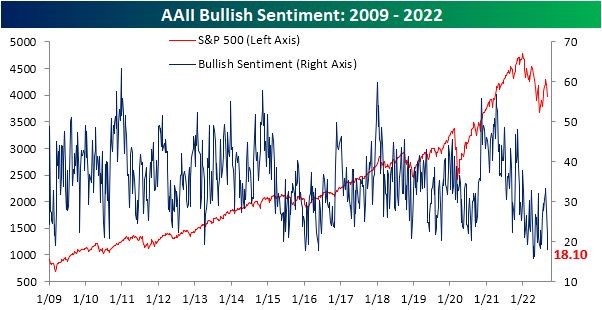
Chart #2 - Investors remain (too?) pessimistic
While the equity markets are still in a long downtrend, we are seeing sporadic spectacular rebounds. This is due to a very cautious market positioning that forces some traders to cover their positions during rebound phases. Indeed, market sentiment has become decidedly pessimistic: the AAII weekly sentiment survey shows that only 18.1% of respondents have a bullish view on the market. This is the third consecutive week of decline in this indicator and the lowest level since the end of April. This excessive pessimism sometimes triggers short selling, as we saw on Wall Street this past week.
Quelle
Bespoke
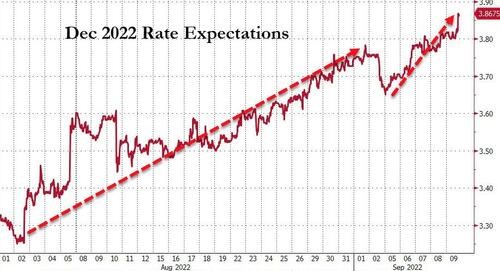
Chart #3 - The market expects the Fed to raise interest rates by 75 basis points in September
As far as monetary policy is concerned, the past week has been characterised by hawkish messages from several Fed members. For example, James Bullard mentioned on Friday that the markets are underestimating the duration and amplitude of the rate hike movement. Christopher Waller pointed out that another "significant" rate hike is expected in September and that inflation is currently far too high. Esther George spoke of the difficulty in fighting inflation, adding that the Fed has some room to raise rates. As a result, the market is now allocating a near 100% probability of a 75bp rate hike by the Fed in September, a further 50bp in November and 25bp in December.
Quelle
www.zerohedge.com, Bloomberg
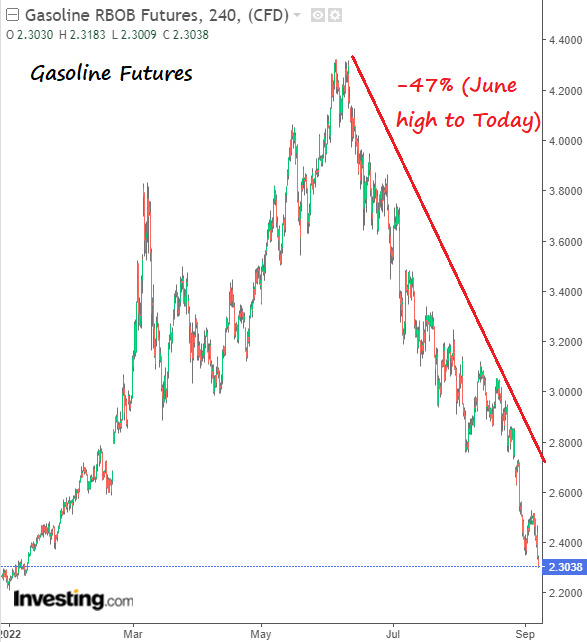
Chart #4 - Some signs of easing on the US inflation front
Investors seem to have been reassured last week by several indicators that the pace of price increases in the US is beginning to slow. Used car prices, for example, have fallen by 9% over the past six months. In 2020, this sector was one of the first to rise. The recent decline in prices can therefore be interpreted as a leading indicator of lower inflation rates to come. Another positive signal is that gasoline futures have returned to early January levels, down 47% from their June peak. Finally, the Fed's "Beige Book" reported that price increases were moderating in nine of its 12 districts, as "lower fuel prices and slower aggregate demand have eased cost pressures, particularly freight rates".
Quelle
www.investing.com, Charlie Bilello
Chart #5 - The Fed exports inflation via the strong dollar
While commodity prices have experienced more or less violent corrections in recent weeks, prices reported in yen continue to explode. Indeed, the indices of raw materials and food prices expressed in yen have multiplied by 2 to 3 in the last two years. The weakening of many currencies (including in the emerging countries) augurs relatively spectacular social tensions in the coming months. In a way, the Fed is exporting inflation through its more restrictive policy stance than other major central banks.
Chart #6 - A 75 basis points rate hike by the ECB
As expected, the European Central Bank (ECB) hiked rates by 75 basis points at Thursday's meeting, the largest rate increase in its history. But as the chart below shows, the ECB still lags far behind inflation. While price inflation has reached a record high of 9.1%, the ECB's deposit rate is 0.75%. The ECB's new inflation projections are well above its target level (2%): 8.1% this year, 5.5% in 2023 and 2.3% in 2024. The ECB has also raised the growth outlook for this year, but reduced the outlook for 2023 and 2024. Despite this relatively restrictive tone, the recent rise of the euro above parity against the dollar does not mean that the EUR/$ decline is over. The rebound is primarily due to the weakness of the dollar, the Japanese yen and the British pound. Indeed, the EUR/CHF continued to weaken last week despite the ECB rate hike.
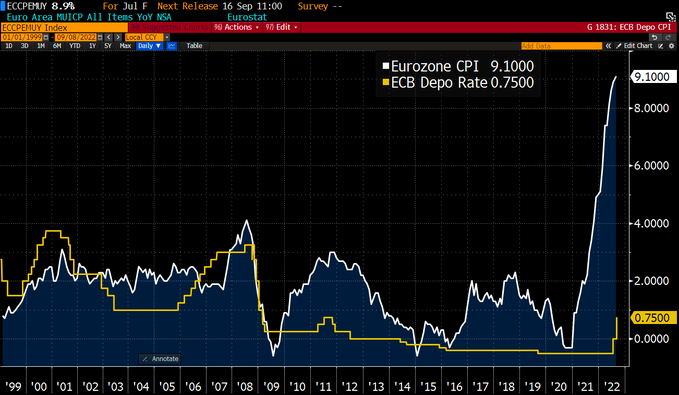
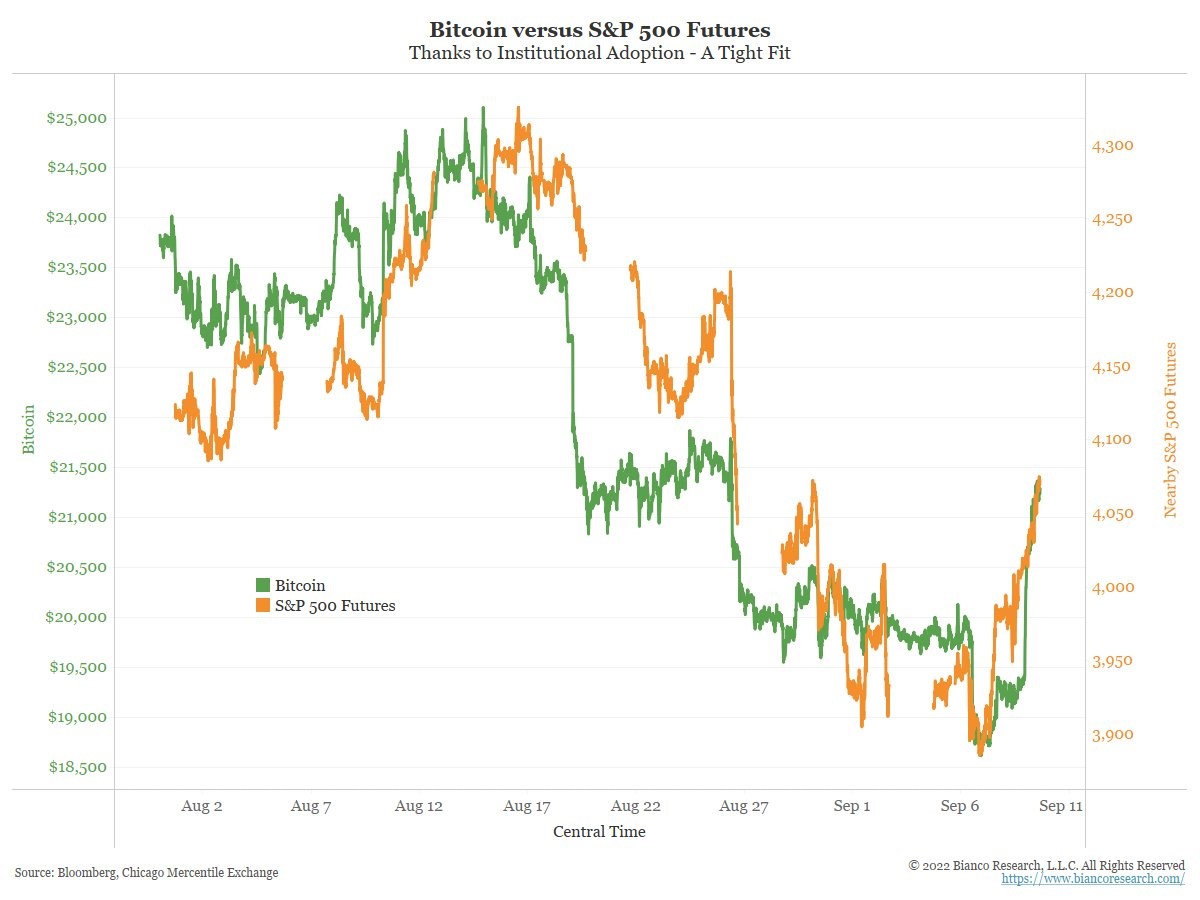
Chart #7 - The very high correlation between Bitcoin and S&P 500 futures
It could be called the "VIX 24/7" index... There is indeed a very close correlation between bitcoin and the S&P 500 futures contract. This close relationship has continued over the past few days as equity markets have rebounded as strongly as the bitcoin. What might the US market open on Monday look like? Perhaps bitcoin should be watched over the weekend, as cryptocurrencies have the advantage of being traded 24/7.
Quelle
James Bianco
Disclaimer
Dieses Werbedokument wurde von der Syz-Gruppe (hierin als «Syz» bezeichnet) erstellt. Es ist nicht zur Verteilung an oder Benutzung durch natürliche oder juristische Personen bestimmt, die Staatsbürger oder Einwohner eines Staats, Landes oder Territoriums sind, in dem die geltenden Gesetze und Bestimmungen dessen Verteilung, Veröffentlichung, Herausgabe oder Benutzung verbieten. Die Benutzer allein sind für die Prüfung verantwortlich, dass ihnen der Bezug der hierin enthaltenen Informationen gesetzlich gestattet ist. Dieses Material ist lediglich zu Informationszwecken bestimmt und darf nicht als ein Angebot oder eine Aufforderung zum Kauf oder Verkauf eines Finanzinstruments oder als ein Vertragsdokument aufgefasst werden. Die in diesem Dokument enthaltenen Angaben sind nicht dazu bestimmt, als Beratung zu Rechts-, Steuer- oder Buchhaltungsfragen zu dienen, und sie sind möglicherweise nicht für alle Anleger geeignet. Die in diesem Dokument enthaltenen Marktbewertungen, Bedingungen und Berechnungen sind lediglich Schätzungen und können ohne Ankündigung geändert werden. Die angegebenen Informationen werden als zuverlässig betrachtet, jedoch übernimmt die Syz-Gruppe keine Garantie für ihre Vollständigkeit oder Richtigkeit. Die Wertentwicklung der Vergangenheit ist keine Garantie für zukünftige Ergebnisse.