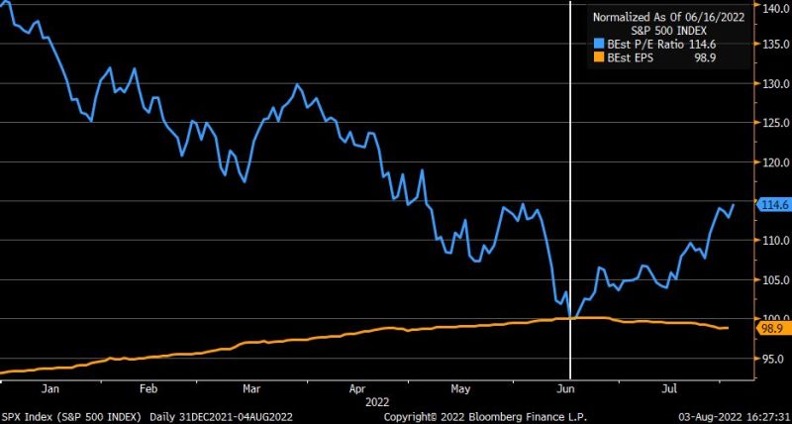
The S&P 500 and the Nasdaq rose again this week despite a slight decline on Friday following the release of employment figures (see chart #5). Since its June 16 low, the S&P 500 has gained nearly 14%. Note that this summer rally is entirely due to an expansion of the P/E (blue line) since earnings expectations (orange line) have been revised downward (slightly). After having anticipated a clear deterioration of the macroeconomic situation during the first half of the year, with a sharp drop in the P/E multiple while earnings expectations were revised upwards, the market now seems to be expecting an improved outlook in the near future.

Charles-Henry Monchau
Chief Investment officer
Chart #1 - Equity market rebound fueled by expanding valuation multiples
Quelle
Bloomberg
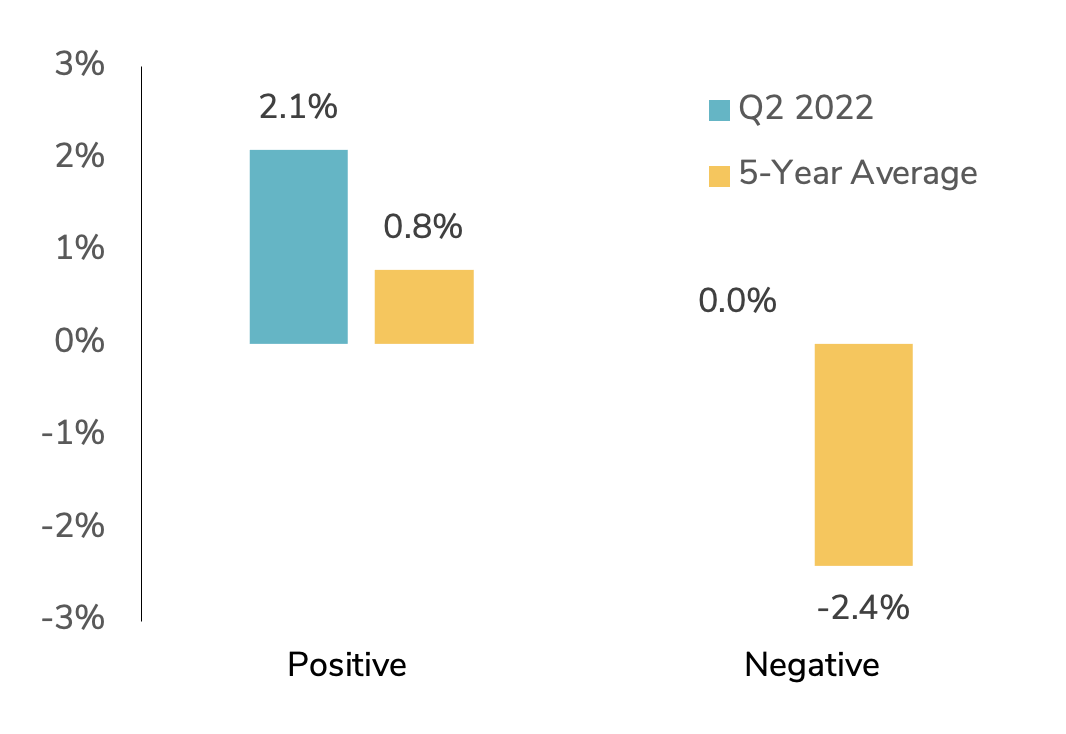
Chart #2 - Companies that report disappointing quarterly results aren’t being punished by the market
The quarterly earnings season is already well underway as 87% of S&P 500 companies have already reported their results. According to Factset's statistics, 75% of companies beat market expectations for earnings per share, while 70% of companies reported revenues above expectations.
For the second quarter of 2022, the aggregate earnings growth rate for the S&P 500 Index was 6.7%. This is the lowest earnings growth rate recorded by the index since the fourth quarter of 2020 (4.0%).
An important point noted by Factset: the market is NOT punishing companies for reporting earnings below expectations. This is very different from the market's behavior during the Q1 earnings call, when disappointing earnings were heavily punished by the market. As shown in the chart below for Q2 releases, companies that surpassed expectations saw their share price rise by an average of 2.1% (over a period that includes the two days before the release and the two days after). This figure is much higher than the 5-year average. Companies that announced earnings below expectations experienced no price change (0.0%) on average, a performance well above the 5-year average.
Quelle
Factset
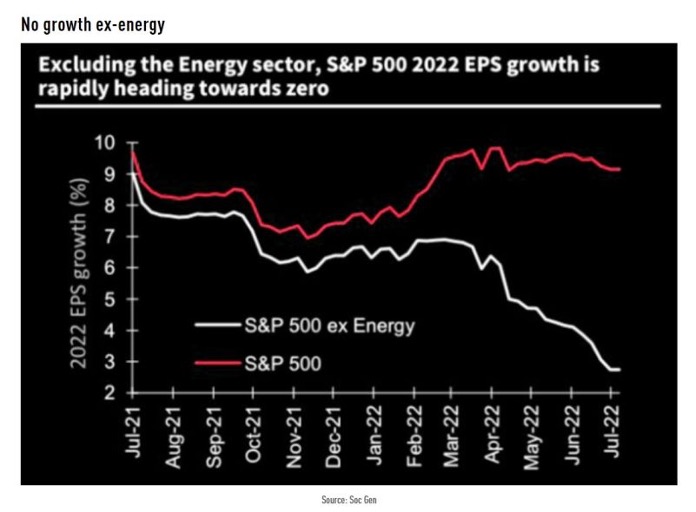
Chart #3 - Company results are very different when the energy sector is excluded
U.S. earnings growth was one of the few bright spots in the first half of the year, as market expectations were gradually revised upward for many months. But as the chart from Société Générale shows, growth expectations have a very different pattern if we exclude the energy sector. While the market expects earnings per share growth of close to 9% in 2022 (red line), expectations outside the energy sector (white line) have been revised sharply downwards and are now close to zero.
Quelle
Soc Gen
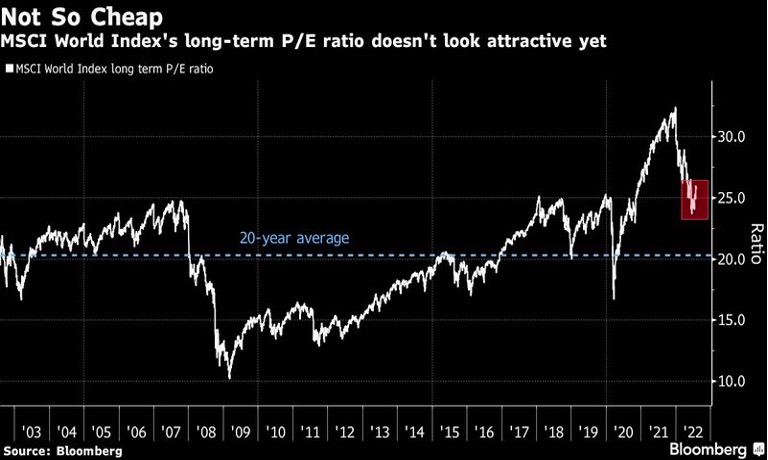
Chart #4 - Stocks are still not cheap
The 12-month price to expected earnings ratio of the S&P 500 Index is 17.5. This multiple is below the 5-year average of 18.6 but above the 10-year average of 17.0. It is also higher than the ratio of 15.8 observed at the end of the second quarter. Since June 30, the S&P 500 Index has risen 9.7%, while 12-month earnings per share expectations have fallen 1.0%. The situation at the global level is similar: as the chart below shows, the long-term P/E of the MSCI World Index remains well above the 20-year average.
Quelle
Bloomberg
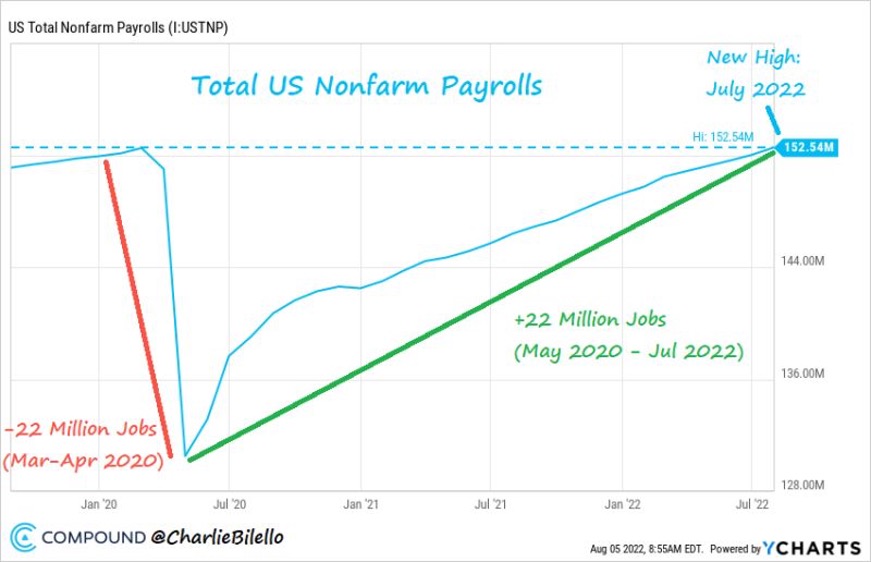
Chart #5 - A strong US employment report
Unemployment is low and wage gains are decent, despite an economy on the verge of recession and record inflation. The numbers released Friday are indeed surprising. The U.S. economy added 528,000 jobs in July, more than double the estimates, while the U.S. unemployment rate fell to a pre- pandemic low of 3.5%. Average hourly earnings rose 0.5% year-over-year, which also beats expectations.
In a way, the U.S. economy has pulled off its biggest employment turnaround in history. As a result of the Covid-19 crisis, 22 million U.S. jobs had been lost in March and April 2020. Since then, 22 million jobs were recreated, and the total number of employees reached a new high in July.
Quelle
Charlie Bilello
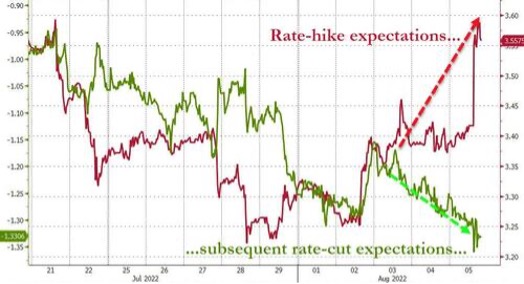
Chart #6 - Expectations for Fed rate hikes are on the rise again
Following the release of the U.S. employment numbers, 2-year bond yields rose sharply and the market revised the rate hike expectations upward for this year (red line). Interestingly, the number of rate cuts expected for 2023 (green line) were also revised upwards.
Quelle
Bloomberg
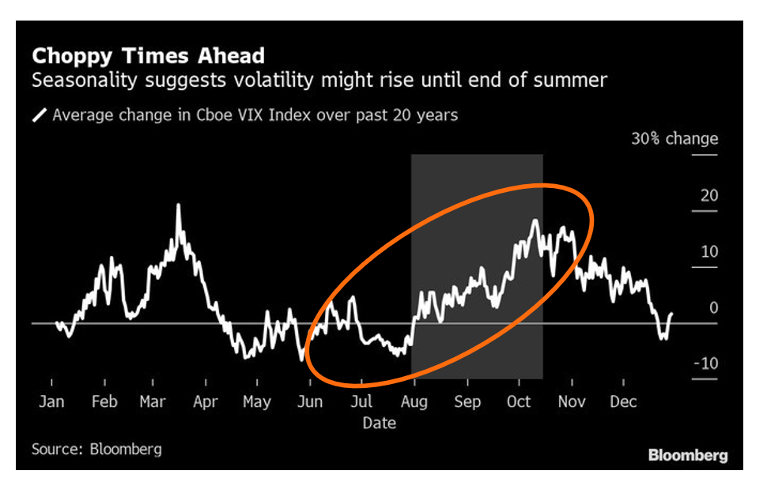
Chart #7 - Volatility tends to increase during the summer
As investors’ sentiment starts to improve, it would be good to remember that summer time does not always rhyme with calm for equity markets. Quite the contrary. In fact, an analysis of the behavior over the past 20 years of the VIX index (a measurement tool used to track the volatility of the S&P 500 index) shows that equity volatility tends to increase during the late summer and early fall. Among the explanations: this is the period when corporate executives and governments usually backtrack on their promises and goals from the beginning of the year (realizing that they cannot be met). It is also a time of the year when liquidity in the market tends to become thin as many stock market operators go on vacation.
Quelle
Bloomberg
Disclaimer
Dieses Werbedokument wurde von der Syz-Gruppe (hierin als «Syz» bezeichnet) erstellt. Es ist nicht zur Verteilung an oder Benutzung durch natürliche oder juristische Personen bestimmt, die Staatsbürger oder Einwohner eines Staats, Landes oder Territoriums sind, in dem die geltenden Gesetze und Bestimmungen dessen Verteilung, Veröffentlichung, Herausgabe oder Benutzung verbieten. Die Benutzer allein sind für die Prüfung verantwortlich, dass ihnen der Bezug der hierin enthaltenen Informationen gesetzlich gestattet ist. Dieses Material ist lediglich zu Informationszwecken bestimmt und darf nicht als ein Angebot oder eine Aufforderung zum Kauf oder Verkauf eines Finanzinstruments oder als ein Vertragsdokument aufgefasst werden. Die in diesem Dokument enthaltenen Angaben sind nicht dazu bestimmt, als Beratung zu Rechts-, Steuer- oder Buchhaltungsfragen zu dienen, und sie sind möglicherweise nicht für alle Anleger geeignet. Die in diesem Dokument enthaltenen Marktbewertungen, Bedingungen und Berechnungen sind lediglich Schätzungen und können ohne Ankündigung geändert werden. Die angegebenen Informationen werden als zuverlässig betrachtet, jedoch übernimmt die Syz-Gruppe keine Garantie für ihre Vollständigkeit oder Richtigkeit. Die Wertentwicklung der Vergangenheit ist keine Garantie für zukünftige Ergebnisse.