Flash

Your questions answered

Mittwoch, 04/06/2022

Below are answers to our client’s most frequently asked questions on the markets, the yield curve inversion, French elections and our portfolios positioning.

Mittwoch 06/04/2022 - 15:35
Charles-Henry Monchau Chief Investment officer

Q&A 1 — Despite challenging headlines (Ukraine invasion by Russia, roaring inflation, Fed hiking rates, etc.), US stocks performance has been diverging from bonds during the second half of March. What are the main reasons for US stocks resilience?

Admittedly, the spread between the S&P rally and Treasury sell-off over the last 10 days of March has been rather spectacular. It is actually the 5th biggest performance differential since 2008. There are several reasons for this:

1) The “Great rotation” from bonds into stocks seems to be finally taking place

Years of quantitative easing were mainly beneficial to global bonds (investment grade, high yield, emerging debt) funds. Indeed, despite the equity bull market, fund flows were mainly directed towards fixed income vehicles. But the global bond market just suffered its greatest drawdown on record. Indeed, the Bloomberg Global Aggregate Bond index is down -6.2% over the quarter. With the return of inflation, investors believe that stocks are a much better hedge against it than bonds. As such, asset allocators are rotating from fixed income funds into equity funds. During the first quarter, fixed income funds suffered major outflows (-$80bn). Meanwhile, equity funds recorded inflows despite all the negative circumstances (war, inflation, Fed, etc.). The inflows into equity funds over the last 12 months have been truly spectacular – see chart below.

Inflow to equities exceeds combined inflow of past 19 years
Quelle
BofA Global Investment Strategy, EPFR

2) Strong US corporates

To the surprise of many, we continue to see analysts revising earnings upwards for 2022. Expectations for S&P 500 earnings growth are now at 9.1%, up from 7.0% at the end of December 2021. The historical norm has analysts lowering annual earnings estimates on average during this period. Balance sheets remain solid as well and companies have room for more share buybacks.

S&P 500: Change in Annual Bottom-up EPS (Dec 31 -Mar 31)
Quelle
FactSet

3) Healthy consumer

Despite the challenges they are facing with higher prices, we continue to see evidence of a relatively healthy U.S. consumer. Jobs report last week underscored this as well. US job market remains quite strong. Non-farm payrolls increased by 431k. The unemployment rate drops to 3.6%, near the pre-pandemic low. Average Hourly Earnings rose by 5.6%, more than expected and job openings outnumber the unemployed.

 It is also worth to keep in mind that U.S households overall entered the year with over $2.5 trillion more in savings than before the pandemic began, which offers some cushion in the face of rising borrowing costs in the year ahead.

4) Real bond yields in deep negative territory

While the increase in bond yields has been spectacular over the last few months, “financial repression” remains and is even intensifying. In Germany, the real bund yields (10 year bunds minus inflation) collapsed to an all-time low of -6.65% despite 10 year yields having turned positive as inflation has jumped to 7.3% in March, their highest level since 1981. German real yields have now been negative for 71 consecutive months. The US 10-year real bond yields is also in deep negative territory. That means that investors are incentivized to keep investing into risk assets.

Q&A 2 — Is the yield curve inversion an ominous sign that a recession is looming, which would means troubles ahead for the stock market?

A key part of the U.S. Treasury yield curve, the difference between 10-year and two-year yields, has now inverted – on two occasions – for the first time since 2019. While a negative spread is often seen as a leading indicator of economic slowdown and recession, historically the indicator is more reliable when the inversion lasts for at least a month and when other parts of the curve are also inverted. Thus far, less than 30% of the Treasury curve is currently inverted. The 10-year and three-month yields, which is often a preferred indicator, remains positive. 

It is also worth keeping in mind that it typically takes between 15 and 20 months on average for a recession to arrive after the inversion of the 10-year versus two-year curve (see table below).

Inverted Yield Curve ( 10-Yr minus 2-Yr) and Recessions ( 1976-2022)

As shown on the chart below, the S&P 500’s historical performance following the most recent five 10s2s yield curve inversions shows a mixed picture. Markets have rallied about 7.0% on average during this period.

Curve inversion and stocks
Quelle
Bianco Research

Q&A 3 — Is the worst of the market correction behind us? Is it time to add more exposure to risk assets?

As highlighted in our latest Asset Allocation Insights (“The Facts, the Knowns and the Unknowns”), we have been gradually reducing our exposure to equities and credit over the last few months based not only on fundamental & technical indicators but also on systematic risk balancing.

While staying invested, we chose to keep a cautious stance and wait for more visibility, on the geopolitical, macro- economic and corporate earnings outlook.

From what we have learned over the last few weeks, we continue to believe that the macro perspective has deteriorated. While we do not anticipate “stagflation” at this stage, our “core” scenario for 2022 has been adjusted toward slower growth and higher inflation. Unlike previous market or macro shocks, central banks are not expected to provide decisive support to the market unless the crisis deepens significantly. As we learned no later than yesterday, key people from the Federal Reserve (Fed Governor Lael Brainard and San Francisco Fed President Mary Daly) are emphasizing the central bank’s commitment to fighting inflation through higher interest rates. They also seek to start a ‘rapid’ balance sheet reduction as soon as May.

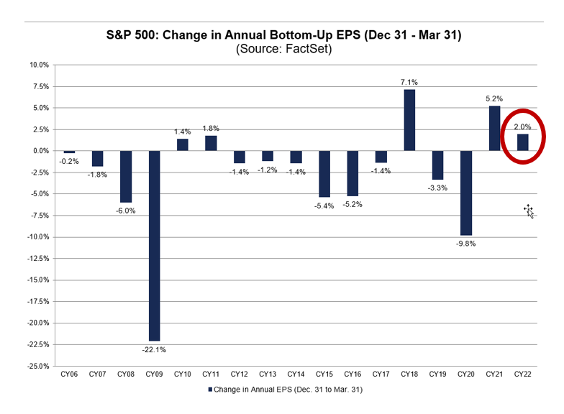
On the valuation side, equity markets are getting cheaper but there is still a risk for earnings forecasts to be adjusted downwards by consensus. On an aggregated basis, our fundamental indicators have turned negative, which lead us to be cautious with regards to our equity exposure.

On the positive side, our market technical indicators have been improving recently mainly thanks to signals stemming from volume, volatility and trend. As such, we have very slightly increased our exposure to global equities during March. Our favorite markets remain the US and Japan. From a style and sector perspective, we keep a mix of growth and value stocks.

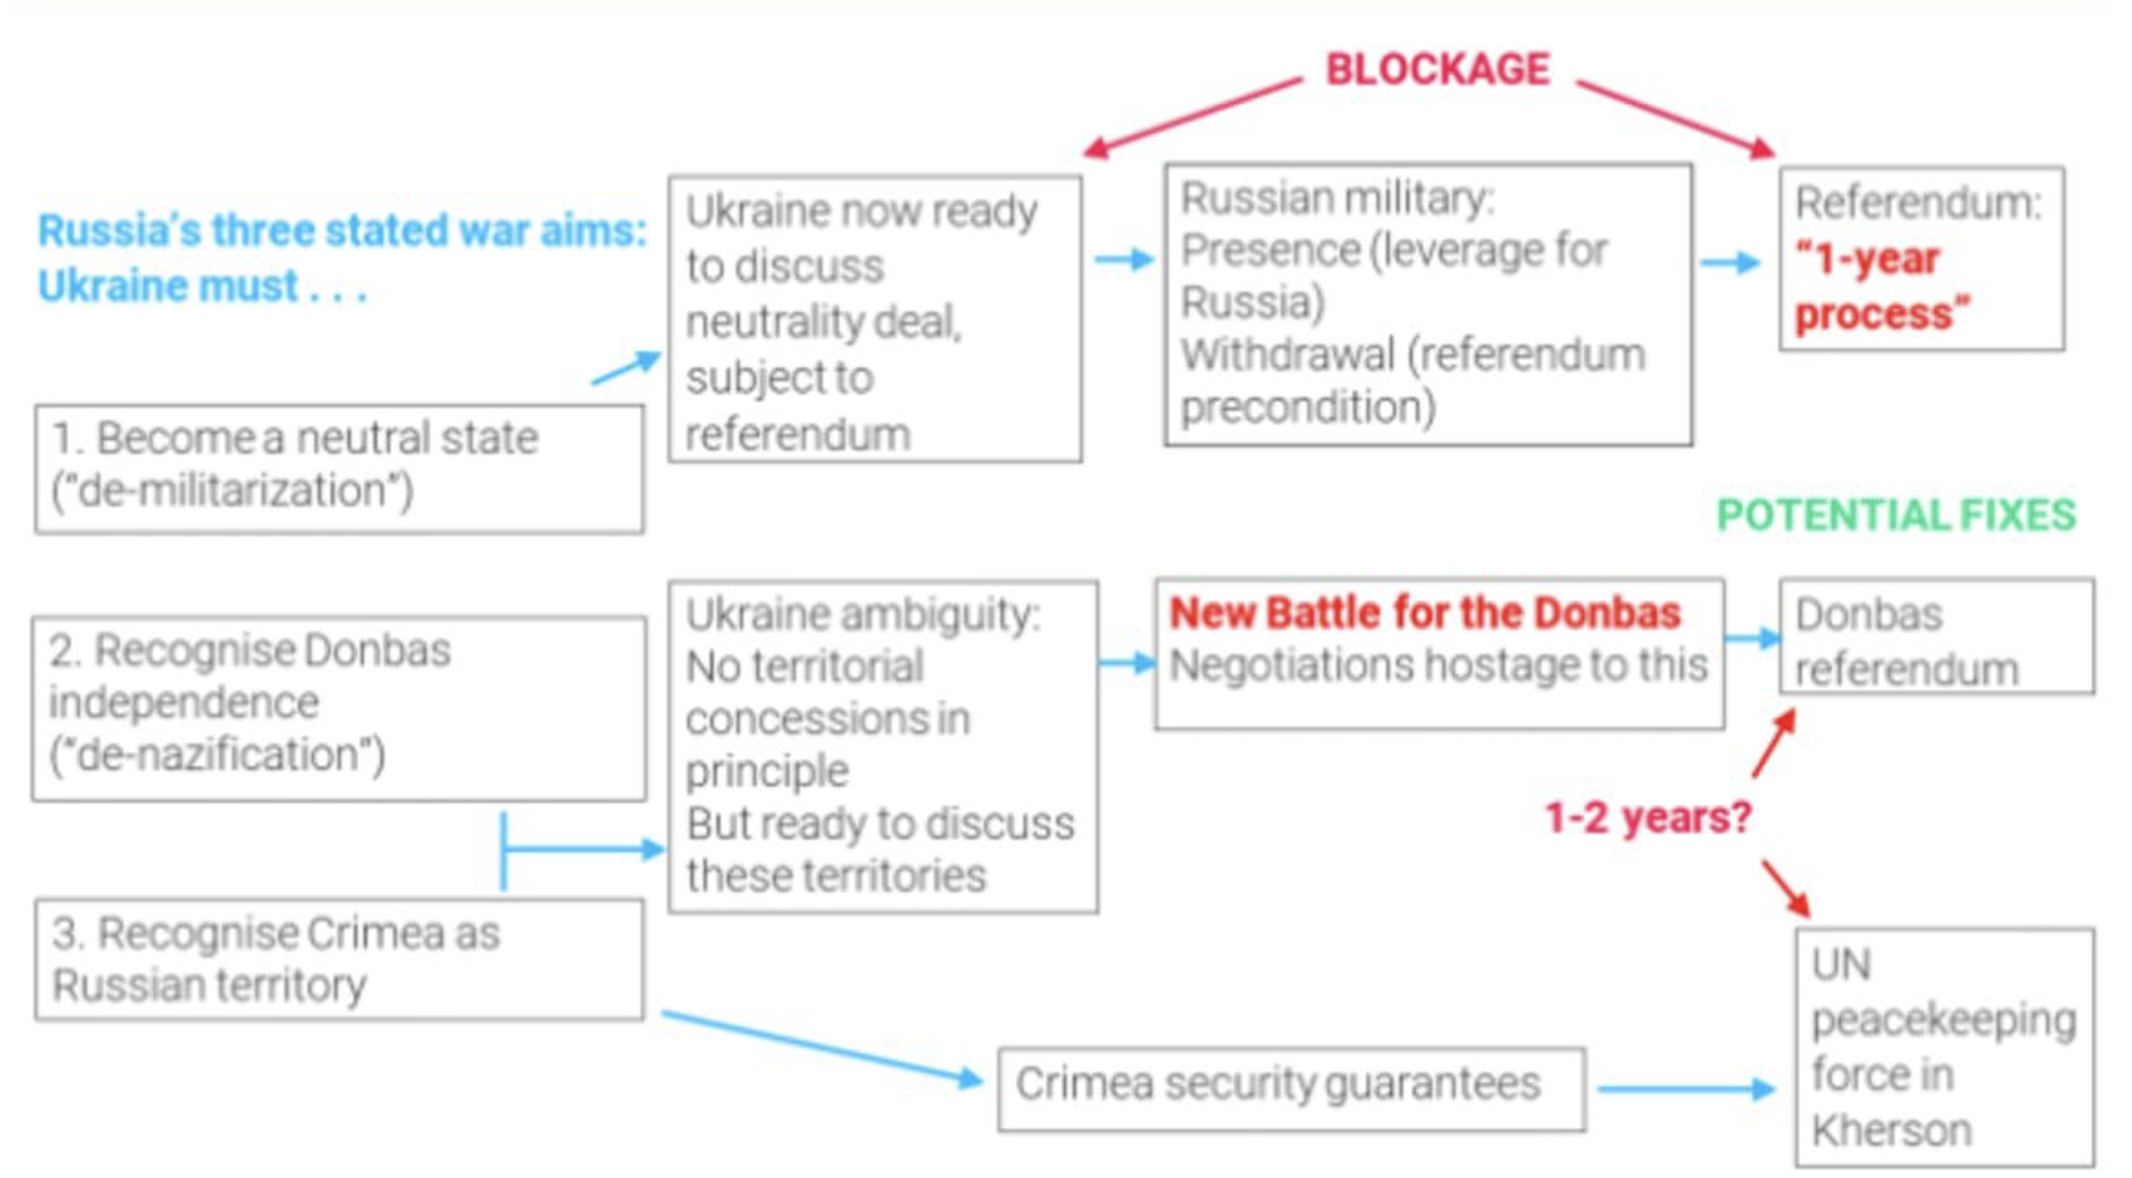
Last but not least, the Russia-Ukraine conflict remains a key risk for the markets. Despite ongoing negotiations, a stalemate with a prolonged economic impact looks likely. As mentioned by TS Lombard, "an early end to the global economic shock from this war and sanctions crisis is unrealistic." There is still a lot of uncertainty regarding the entire situation and the longer it takes to end the conflict, the longer the commodity supply shock will last, driving up commodity prices and thus inflation higher. As shown on the chart below, there is a difficult path to find a resolution to the Russia-Ukraine war. The organization of referendums and the battle for Donbas could take years. Sanctions on Russia create a major issue for the global economy: energy, metals and soft commodities are needed for virtually everything, yet Russia exports many raw materials, and unlike 1973, it’s not just the price of oil, but the price of all commodities that is surging. This ultimately increases the risk of a stagflation scenario which is not the best economic outcome for risk assets.

Fraught paths to Russia-Ukraine resolution
Quelle
Source: TS Lombard

Q&A 4 — French elections. What are the odds of a major surprise? How to hedge it?

The first round of the French presidential election will be held on Sunday and the second round will take place 2 weeks later. Until last week, investors have been ignoring this political event as the odds of a reelection of the incumbent, Emmanuel Macron, were extremely high. But while the polls were giving Macron a comfortable lead over the right-wing populist Marine Le Pen, recent polls seem to show that Macron’s projected first round lead over Le Pen is narrowing to just 4% versus more than 13% four weeks ago. Meanwhile, polls for the second round give a small lead for Macron over Le Pen (53% to 47%) which is significantly tighter than 2017 victory by Macron (61% to 39%).

France - opinion polls for second round of the presidential election (24 April)
Quelle
French opinion polls, Wikipedia

The bond market took notice as the yield spread on 10-year OATs (French government bonds) over German bunds has widened by roughly 10 basis points while French bank shares have been under pressure.

French 10y risk spread over Germany
Quelle
Bloomberg

We believe that the most likely outcome for this French election is a Macron victory on April 24 as voters historically vote for center parties in the second round. But the odds of a big a surprise are significantly greater today than in 2017, or even a few weeks ago. Macron remains disliked by a large number of French voters and Le Pen's Rassemblement National party has become more “conventional” than it used to be in the past. A high level of absenteeism could also impact the final outcome.

In the case of a Le Pen victory, investors are likely to price in a greater risk of Eurozone breakup and this would push French and periphery spreads over Bund still higher. Some investors might be tempted to hedge against such an outcome by shorting French OAT (in EUR) and going long Swiss Confederation (in CHF).

Q&A 5 — What are the investment implications of the points aforementioned? How should investors position portfolios?

We would like to highlight 4 key investment principles:

#1: STAY INVESTED:

As highlighted before, cash and bonds real yields are still in deep negative territory. As such, equities should continue to play a more meaningful role in portfolios, as historically equity returns have outpaced inflation rates over time. While fixed income has underperformed so far this year as rates have risen, we believe that over the long-term, bonds will continue to play a valuable role in portfolios.

#2: STAY DIVERSIFIED:

While value-style and cyclical investments should continue to benefit from the ongoing economic re-opening and commodities bull-run, we also see opportunities in more defensive sectors of the market as well as large-cap growth (including technology) stocks, particularly as the pace of economic growth may moderate further in 2023/2024.

#3: FOCUS ON QUALITY AND SELECTIVITY:

Earnings growth tends to move higher as inflation rises, and those companies with pricing power typically benefit more. Within equities, we favor U.S. large caps with a focus on quality.

#4: TIME FOR ACTIVE MANAGEMENT:

Volatility is likely to remain elevated, and one to three corrections in any given year is the norm. However, we may use pullbacks as opportunities to rebalance or appropriately diversify portfolios.