Feature

The week in seven charts

Lundi, 10/10/2022

A strong week for oil prices


Uncorrelated strategies make hedge funds this year’s winning play, equities continue to drop and OPEC+ fights falling oil prices. Each week, the Syz investment team takes you through the last seven days in seven charts. 

Lundi 10/10/2022 - 16:08
Charles-Henry Monchau Chief Investment officer

Chart #1 — Rising bond yields continue to weigh on equity markets

For the first time in four weeks, US equity indices posted positive weekly performances, thanks to strong gains on Monday and Tuesday (+5.6% cumulative, the best two-day gain since 2020 and the third best October start since 1930). However, US equities gave up most of their gains by the end of the week, with the S&P 500 falling -2.8% on Friday. 


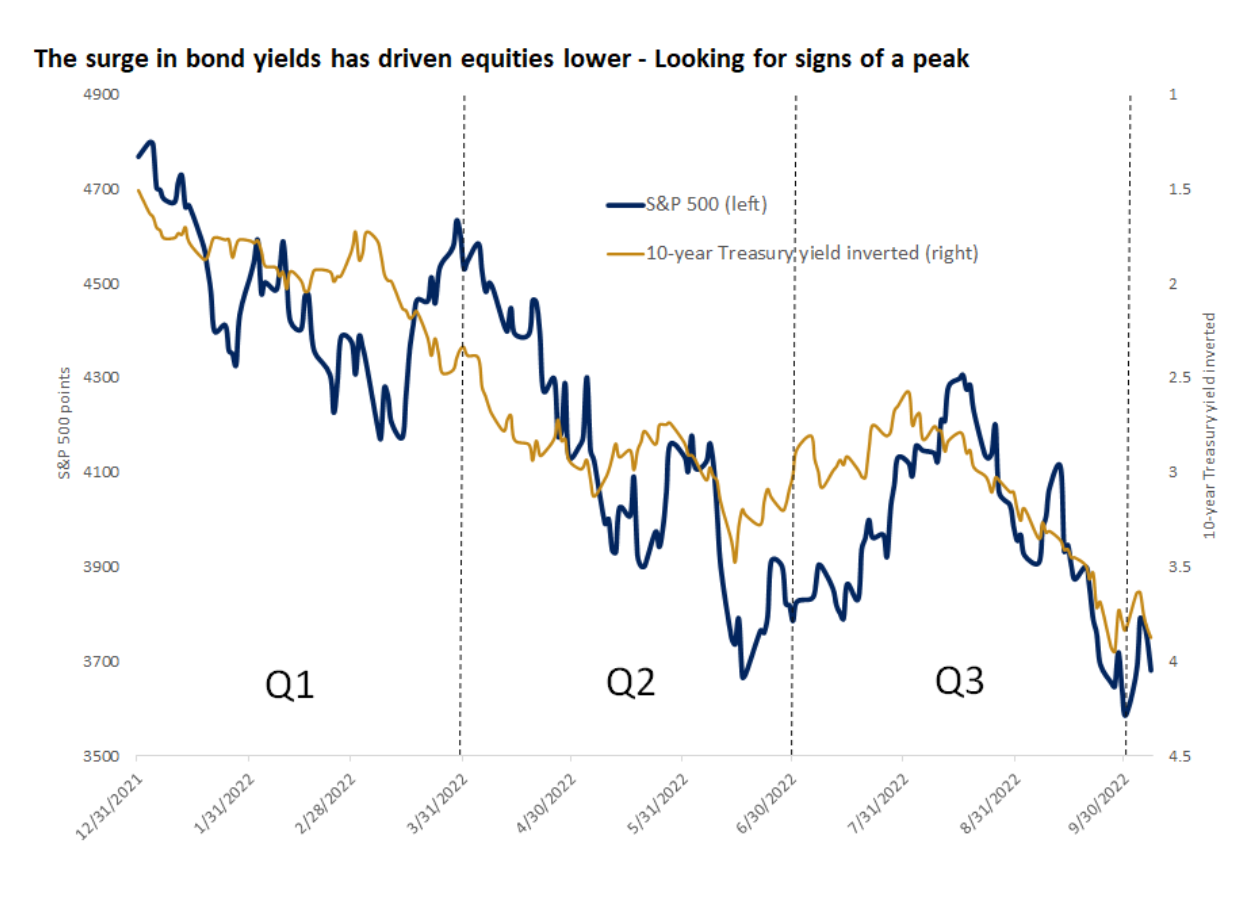
So far this year, the S&P 500 has recorded 52 declines of at least 1%, the most negative volatility in any calendar year since 2008. The end of quantitative easing and soaring bond yields continue to weigh on equity markets. 

S&P 500 Index (blue) vs. Inverse US bond yields (yellow)
Source
Edward Jones

Chart #2 — From « TINA » to « TARA »

The old adage - TINA, or "There Is No Alternative" - had generated a buying frenzy in the most speculative segments of the market over the last decade (meme stocks, small & mid caps, crypto-currencies, Miami flats, mountain chalets, etc.), as bonds offered near-zero (or even negative in some markets) returns. Now, the fact that 2-year US Treasuries are offering yields of 4.3% fundamentally changes the game. The market is now more favourable to high yield investments and much less so to assets that have benefited from the QE period (technology, speculative stocks, etc.). Hence the new acronym "TARA" ("There Are Reasonable Alternatives"). 

From TINA (There Is No Alternatives) to TARA (There Are Reasonable Alternatives)
Source
Jeff Weniger

Chart #3 — Earnings growth expectations for 2023 seem overly optimistic

Analysts' estimates for Q3 earnings growth have fallen considerably, ahead of the earnings season (from +10.5% increase five months ago to +2.8% now). On the other hand, estimates for next year remain high (given the macroeconomic challenges ahead) and could therefore be adjusted downwards.

Changes in S&P 500 earnings growth estimates for the third quarter and calendar year 2023
Source
Edward Jones

Chart #4 — US rates are expected to rise further

Last week was a volatile one for bonds. While bond yields fell at the beginning of the week, the 2-year yield jumped to 4.29% on Friday as the market expected a significant rate hike at the next Fed meeting. The probability of a 75 basis point hike on November 2 has increased to 80%. 


The resilience of the US labour market has once again dashed hopes of a Fed pivot. The market continues to review the path of policy rates upwards and now expects them to peak at 4.6% next year.

Market expectations for the US terminal rate
Source
Edward Jones

Chart #5 — A strong week for oil prices

WTI crude oil recorded its biggest weekly rise since March on oil supply concerns. OPEC+ decided to cut oil production by 2 million barrels per day. If sustained, the rebound in oil prices could drown out hopes of lower headline inflation by the end of the year, even as inflation in the non-energy sectors continues to rise.


OPEC+'s announcement on Wednesday makes US President Joe Biden's plan to use US reserves for 1 million barrels per day increasingly futile but also difficult to sustain as US strategic oil reserves are currently at historically low levels...

Oil prices surge as OPEC cuts production
Source
Bloomberg

Chart #6 — The US jobs market’s resilience

When good news becomes bad news for the markets... The US economy added 263,000 jobs in September, the lowest number since April 2021. However, this figure is higher than economists had expected. In addition, the unemployment rate fell to a 50-year low of 3.5% from 3.7% the previous month. 


Why were these 'good' figures misinterpreted by the markets? Simply because this statistic shows that the economy is not slowing down as much as the Federal Reserve would like. Indeed, non-farm payrolls rose for the sixth consecutive month, the longest streak since 1998...


Another statistic published last week seems to show that the US job market is slowing. The number of job offers fell by 10% in August, the largest drop since April 2020 and the fourth decline in the last five months. The gap between the number of vacancies and the number of unemployed remains high by historical standards, but it is starting to narrow. Companies are slowing the pace of hiring, a step that typically precedes job cuts.

US employment statistics (vs. expected and previous month's figures)
US employment statistics   (vs. expected and previous month's figures)
Source
Bloomberg

Chart #7 — The come-back of hedge funds

So-called "market uncorrelated" hedge fund strategies (CTA, Macro, Multi-strategy) are performing remarkably well in 2022 - see below their performance at the end of September. Are hedge funds coming back in force?

Year-to-date performance of various hedge fund strategies (as of 30 September 2022)
Source
Aurum