Wall Street had another volatile week, with the S&P 500 posting losses for the sixth consecutive week. This is the longest stretch of negative weekly performance since 2008. Investors seem increasingly skeptical about the Fed's ability to achieve a "soft landing" for the economy. At its lowest point on Thursday, the S&P 500 was down nearly 18% from its December 2021 peak, just 2% above the threshold that typically defines a bear market. US stocks rebounded on Friday, helped by a rally in Tesla after Elon Musk tweeted that his deal to buy Twitter - financed in part by the sale of part of his stake in Tesla - was "pending". On Wednesday, US inflation data weighed on investor sentiment. Indeed, the increase in prices for a global basket of goods and services fell slightly from March's pace, but not as much as expected: inflation stood at +8.3% year-on-year against +8.1% expected by the consensus.
The week in seven charts
Lundi, 05/16/2022S&P 500 down for the 6th consecutive week
Nowhere to hide as inflation soars. Tech stocks and crypto take a beating, while value stocks outperform growth stock. The Syz investment team takes you through the last seven days in seven charts.

Chart #1 - S&P 500 down for the 6th consecutive week
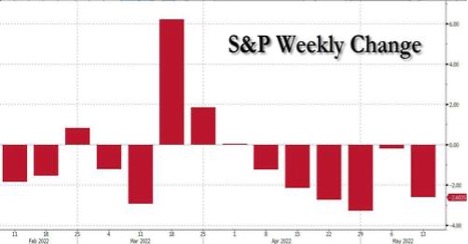
Chart #2 - No respite for technology stocks
The rout in technology stocks continues: rising bond yields continue to weigh on the Nasdaq's price/earnings ratio. Admittedly, the yield on US Treasury bonds fell back below 3% at the end of the week. But the tightening monetary environment is not favourable to growth stocks in general and technology in particular. And it's not just small and mid-caps that are suffering. Apple stock - an icon of the bull market in the era of quantitative easing - is now in bear territory. Energy giant Saudi Aramco has become the world's largest company by market capitalisation - quite an achievement.
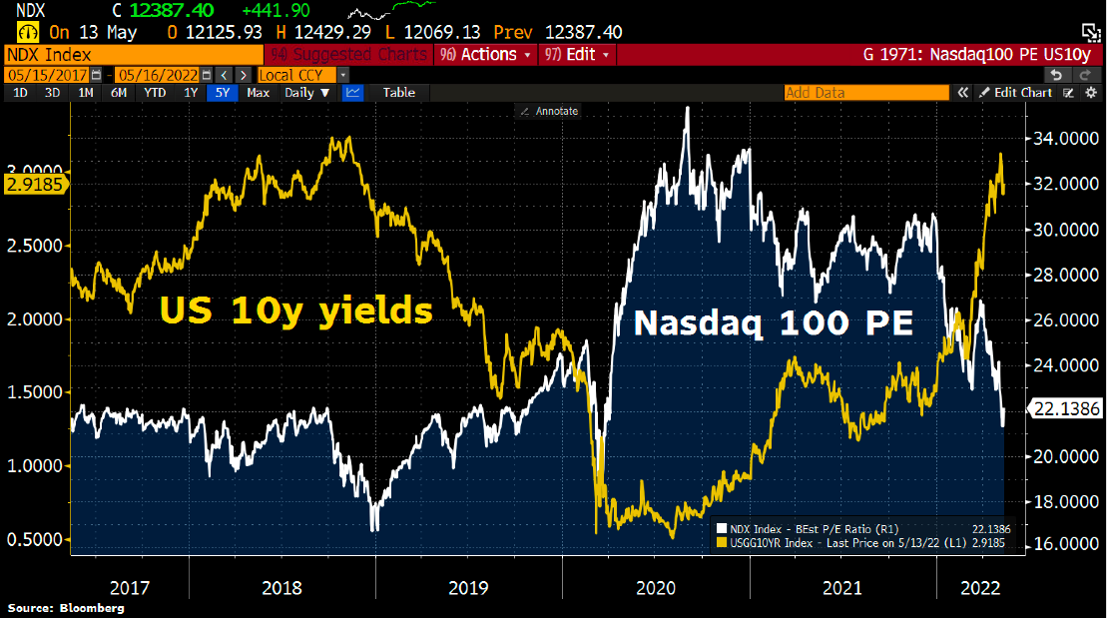
Chart #3 - Fund flows against the market trend
Despite the sharp decline in the Nasdaq, retail investors are still attracted to high-growth, innovation-oriented stocks. The Ark Invest Innovation ETF (ARKK) had become a reference in this segment in 2020-2021. But for several months now, the flagship ETF of the management company founded by Cathie Wood has been falling steadily. ARKK ETF is down 60% year-to-date. However, "small investors" continue to believe in a possible rebound, having injected no less than 1 billion dollars of new money into the fundin 2022. By contrast, largely driven by Russia’s war in Ukraine, the US oil stock ETF SPDR Energy (XLE) has risen by 40% since the beginning of the year but has suffered redemptions. From a contrarian point of view, this divergence between performance and fund flows suggests that the energy sector might continue to outperform.
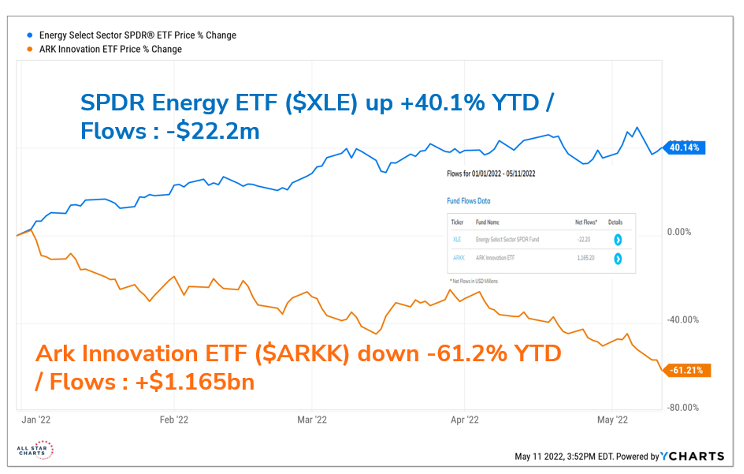
Chart #4 - Is the outperformance of value stocks just starting?
Since the beginning of the second quarter, the outperformance of the value compared to growth stocks has reached extremes unseen since the late 1990s (+10.5%). This differential was already significant in the first quarter (+8%). By how much can this valuation gap between growth and value stocks close over time?
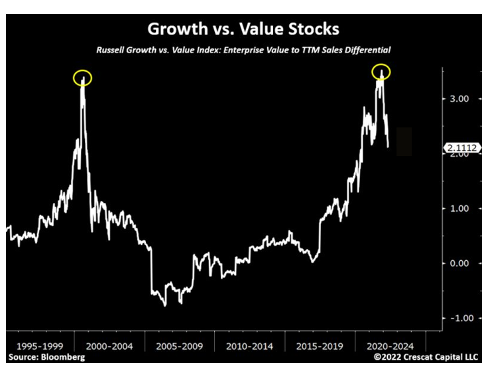
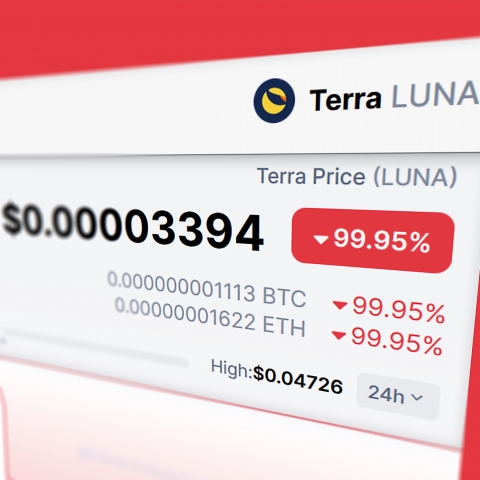
Chart #5 - TerraUSD stablecoin triggered a crypto- crash
The general move of asset liquidation which has been in place since November 2021 is affecting the most speculative segments of the market even more. Cryptocurrencies had already suffered a dramatic decline before the start of last week. The downward movement was further accelerated by the fall of a "stablecoin", the TerraUSD (UST). Stablecoins play a very important role in the cryptocurrency ecosystem. In principle, they allow crypto- currency investors to "park" their assets in digital assets that replicate the evolution of "fiat" currencies, i.e. the dollar, the euro, etc. These stablecoins are therefore supposed to be stable because they are backed by "traditional" currencies. The sudden de-anchoring of the TerraUSD last week sent shockwaves through the cryptos as this sudden shock threw all stablecoins into turmoil, including Tether, which accounts for almost half of the capitalisation of this segment. For now, Tether's peg seems to be holding. In fact, it is the stablecoins that are based on algorithms (such as TerraUSD) that have stalled while those based on physical reserves (Tether, USDC, etc.) are holding up - at least for now.
However, these spectacular dips have cast a pall over the whole crypto universe. Bitcoin is now down over 60% from its all-time high in October 2021. The market capitalisation of all cryptos has suffered a decline of $1.7 trillion from its highs.
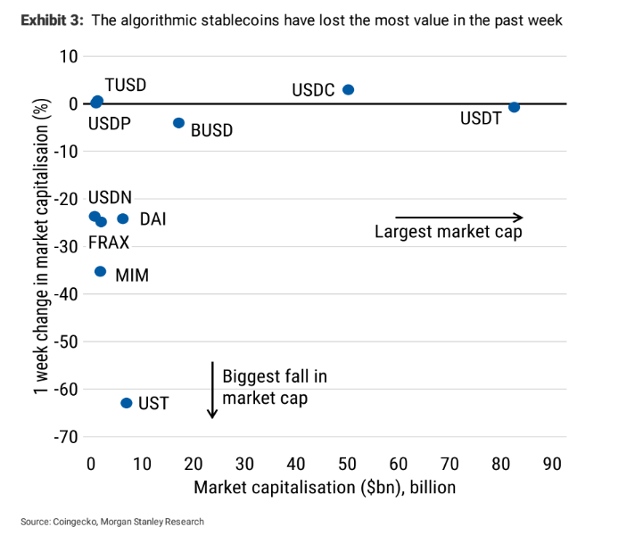
Chart #6 - Inflation hedge? there is only one left...
Gold prices continued to fall last week. It traded at its lowest since February and is now down year-to-date. After the fall of the Nasdaq, bitcoin and now gold, it is clear that only one inflation hedge has worked so far: commodities in the broad sense (i.e. energy, agricultural commodities, etc.).
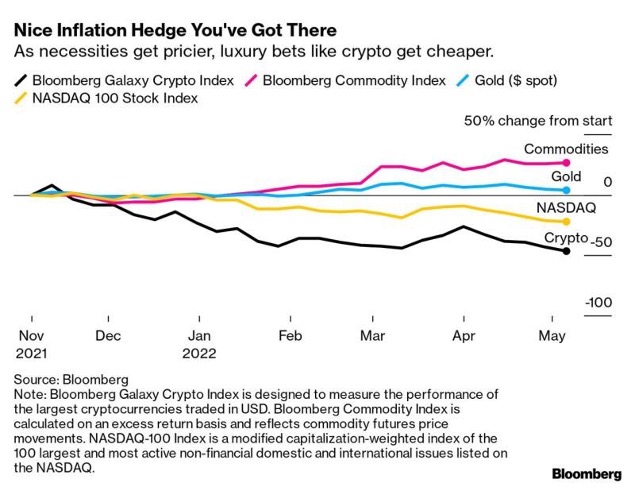
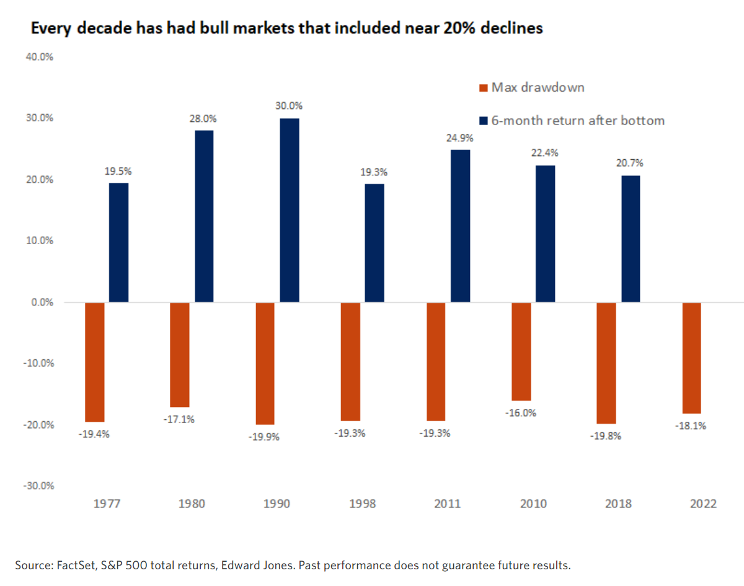
Chart #7 - Buying opportunities?
Let's try to end on a positive note...
Over the last 50 years, the S&P 500 has been down about 20% several times and then rebounded dramatically - at least when business and economic fundamentals remained strong.
As for bitcoin, it has suffered numerous declines of around 50% and has always recovered...
Disclaimer
Le présent document a été publié par le Groupe Syz (ci-après dénommé «Syz»). Il n’est pas destiné à être distribué ou utilisé par des personnes physiques ou morales ressortissantes ou résidentes d’un Etat, d’un pays ou d’une juridiction dans lesquels les lois et réglementations en vigueur interdisent sa distribution, sa publication, son émission ou son utilisation. Il appartient aux utilisateurs de vérifier si la Loi les autorise à consulter les informations ci-incluses. Le présent document revêt un caractère purement informatif et ne doit pas être interprété comme une sollicitation ou une offre d’achat ou de vente d’instrument financier quel qu’il soit, ou comme un document contractuel. Les informations qu’il contient ne constituent pas un avis juridique, fiscal ou comptable et peuvent ne pas convenir à tous les investisseurs. Les valorisations de marché, les conditions et les calculs contenus dans le présent document sont des estimations et sont susceptibles de changer sans préavis. Les informations fournies sont réputées fiables. Toutefois, le Groupe Syz ne garantit pas l’exhaustivité ou l’exactitude de ces données. Les performances passées ne sont pas un indicateur des résultats futurs.