Feature

The week in seven charts

Lunedì, 05/30/2022

The S&P 500 ends 7-week losing streak

Is there light at the end of the tunnel for equity markets? The S&P 500 catches a break, bad macro figures may slow down Fed rate hikes and cryptos are still not back up from their last know out. The Syz investment team takes you through the last seven days in seven charts.

Lunedì 30/05/2022 - 14:43
Charles-Henry Monchau Chief Investment officer

Chart #1 - The S&P 500 ends 7-week losing streak

Over the past week, the S&P 500 has risen 6.6%, breaking a seven-week losing streak and posting its biggest weekly gain since November 2020.

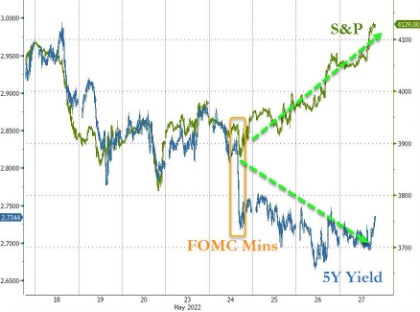
Both equity and bond markets began to rebound on Tuesday ahead of the release of the May FOMC meeting minutes the next day. Although the tone of the "minutes" is decidedly tightening, the fact that there were no nasty surprises brought some relief to market participants. The minutes also hinted at greater medium-term flexibility on the part of the Federal Reserve. In other words, if growth and/or inflation were to slow down more sharply than expected, the Fed would give itself the option of pausing the rate hike cycle.

This news triggered a fall in bond yields, especially at the short end. A drop in yields that allowed the equity markets to rebound.

The S&P 500 ends 7-week losing streak
Fonte
Bloomberg, www.zerohedge.com

Chart #2 - Bad news is good news again

Another factor that led to positive performance in the equity and bond markets last week was the fact that recently released macroeconomic figures were below investors' expectations. The US economic surprise indicators point to a sharp slowdown in US growth. These bad figures suggest a lower than expected number of rate hikes, which delights the markets. Bad news becomes good news in a way.

Bloomberg ECO US Surprise Index
Fonte
Bloomberg, The Daily Shot

Chart #3 - Inflation expectations are tumbling

The Fed's preferred measure of inflation (PCE) slowed in April from March to +6.3% y/y compared to +6.2% expected and +6.6% the previous month. This report includes an impressive asset reversal for non-durables: the price index for non-durables is down from the previous month, the first negative rate since October 2020 and the largest decline since May 2020.

The market is gradually adjusting inflation expectations as the five- and ten-year inflation expectations have fallen by the most since the beginning of the pandemic in recent weeks.

Inflation expectations are tumbling
Fonte
Edward Jones

Chart #4 - Will hedge funds increase their exposure?

This rebound in the equity markets is taking place in a context of extreme pessimism on the part of investors. This is what a CNN survey and the survey conducted by the All Americans Institutional Investors (AAII) show.

The market rebound is prompting some investors to reverse their positions. For example, equity fund inflows are positive for the first time in seven weeks (source: BofA). As for hedge funds (long/short equities), they had aggressively reduced their gross exposure in recent months. Will they reverse their positioning and return to the equity markets?

Evercore ISI Hedge Fund Survey: Gross Exposure May 25
Fonte
ISI, The Daily Shot

Chart #5 - What’s next for equity markets?

Two of the three biggest declines in the S&P 500 over the past 15 years have bounced back near the 20% bear market threshold. Are we in the context of 2008 or 2011/2018?

The Fed's ability to engineer a soft landing for the economy and the ability of companies to maintain profit margins in this inflationary environment are among the key determinants of the direction equity markets will take next.

What’s next for equity markets?
Fonte
Edward Jones

Chart #6 - Energy stocks continue to perform well

The market seems to have revised upwards its expectations for ECB rate hikes over the past week. The yield curve is now forecasting a 104 basis point rate hike in 2022 for the Eurozone, up from 86 basis points the previous week. It would appear that comments from Mr Knot - a member of the European Central Bank - have had an impact on revising expectations. Mr Knot said that he was in favour of a 25 basis point hike in July, but that a larger hike could be justified.

It is interesting to note that when the market anticipates more monetary tightening from the ECB, peripheral bond issuers are immediately impacted. For example, the risk spread for the 10-year Italian bonds has risen by over 200 basis points recently, pushing 10-year Italian yields above 3%.

Energy stocks continue to perform well
Fonte
Mac10

Chart #7 - Cryptocurrencies still in a severe bear market

While the Nasdaq and technology stocks had a great week, this was not the case for cryptocurrencies, which were down sharply. For once, there is a decoupling between cryptos and big-tech. The correlation between Nasdaq and Bitcoin has collapsed as it is now negative.

Note that JP Morgan has just published a note giving a target of $38,000 on bitcoin (BTC). "Last month's correction in the crypto market looks more like a capitulation from what we experienced last January/February. We expect an upside for bitcoin and cryptocurrencies more generally," the research note said.

Cryptocurrencies still in a severe bear market
Fonte
www.zerohedge.com, Bloomberg