Flash

Your questions answered

Venerdì, 04/22/2022

Below are answers to our client’s most frequently asked questions on inflation, the yen and the surge in commodities prices.

Venerdì 22/04/2022 - 15:47
Charles-Henry Monchau Chief Investment officer

Q&A 1 - Time to call a peak in inflation?

Many investment banks (Goldman Sachs, JP Morgan, DB, BofA, Morgan Stanley, UBS, etc.) are all calling the peak in inflation after last week’s publication of a 8.5% year on year jump of US Headline CPI. The main reason for their call stems from the fact that US core CPI not only missed expectations but also rose to the lowest level since September 2020 (+0.3% M/M). Moreover, shelter and rental space slowed down. Last but not least, used car prices fell 3.8% in March, their second monthly decline after a series of large increases. This set of numbers was interpreted as an encouraging sign.

As usual, the devil is in the details. The base effect will indeed normalize after March following the 2nd anniversary of the post-covid collapse. But there are also reasons to be cautious about this set of numbers. First, this is just one data point and thus not enough to call it the start of a trend. Second, food prices have yet to have the full impact of increases due to the lagged pass-through. While this is not part of the core CPI, US consumers will never the less feel the pain for higher food prices soon. The same applies for energy prices which remain under the threat of a full embargo on Russian oil by the Eurzone (see Q&A 3). Third, while supply chain bottlenecks seem to have eased recently, we could soon see the effects of covid-related lockdowns in China (see Q&A 3) and sanctions on Russia would create additional constraints.

Another reason to be skeptical of the calls for peak inflation is that the median price increase camein at +0.48%, which is significantly higher than the core. And the last but very important point: headline US inflation didn’t just reach a fresh 4 decades high of 8.5% in March, it also got wider (see chart below). 76% of the goods and services measured by the Bureau of Labor Statistics saw gains of at least 4% YoY. That’s up from just two-thirds in February, and less than 5% at the end-2019. We are thus NOT yet out of the woods...

US Inflation range by items yoy %
Fonte
Bloomberg

Q&A 2 - What is the reason behind the yen’s weakness? What are the implications for global markets?

The weakening of the Japanese yen (-10% against US dollar since the start of the year) can be explained by two factors: 1) The downward revision of global growth as Japan is seen by investors as a very leveraged markets in the world economy); 2) The widening gap between US Treasury yields and JGBsthe Japanese equivalent. Indeed, the US Federal reserve is on its way to normalize its monetary policy through rate hikes and a potential reduction of the size of its balance sheet. Meanwhile, Japan continues to pursue a dovish monetary policy and consider yield curve control (YCC) to prevent any rise of the long-end the JGBs yield curve. And this despite the fact that Japan’s CPI is also on the rise. This widening yield gap is putting downward pressure on the Japanese yen which is now trading at a two- decade low against the greenback.

On a global scale, the downside risk of a weaker yen could lead to competitive currency devaluations in the rest Asia including the Chinese Yuan. And there could be some ripple effects such as further weakening of the euro and the risk of an emerging markets crisis due to the strong dollar.

A weaker yen is also an issue for Japan which is a huge commodity importer. Resource-poor Japan has seen its trade deficit hit a 8-year high in March as commodities denominated in Yen have increased by 50% since the start of the year. Japan depends overwhelmingly on fossil-fuel imports to meet its energy needs and soaring oil and LNG prices are starting to hurt both businesses and consumers.

As the USD/JPY enters the 127-130 range, the odds of direct forex intervention and/or for the Bank of Japan (BoJ) to abandon its bond yield target are rising. But history shows that intervention rarely delivers their policy objective of changing the trend in the currency. And this week’s announcement by the BoJ doesn’t seem to go into this direction (see below).


BOJ Resumes
BOJ Resumes

As highlighted in a recent Reuters article, traders’ positioning data shows long dollar/yen positions have built to a three-and-a-half year high but are short of the peaks achieved in 2017, 2013 and 2007. This suggests that there is room for investors to keep selling for longer. Neither Japanese retail long positions in yen nor foreign speculative short positions have kept pace with the speed of the yen's selloff, according to J.P. Morgan FX strategist.

We will thus continue to monitor the USD/Yen move very closely. At our last Asset Allocation meeting, we downgraded our view on the Yen to cautious. We are currently hedged on the Yen in our discretionary accounts. On the equity side, note that the weakening of the yen is a tailwind for Japanese exporters.

Q&A 3 - What’s our take on the continued rise of global commodities prices (including food)?

The world is facing a major commodity supply / demand imbalance situation and the Russia / Ukraine conflict is not the only reason. Indeed, there have been years of under- investment into commodities CAPEX and as demand picks up post-COVID, there is just not enough supply to match demand. Obviously, the invasion of Ukraine by Russia and the ensuing sanctions have worsened the situation as Russia basically exports every type of commodities. With the sanctions, the supply situation for a large number of commodities is even tighter than before. The supply / demand imbalance is pushing commodities prices higher and the vast majority of commodities curves are currently trading in backwardation (see chart below), which is another sign of commodity strength.

Number of commodities in backwardation
Fonte
Bloomberg, TS Lombard

High commodities prices are likely to prove self-defeating at some point as they will lead to demand destruction. But the time needed to adjust production / supply for most commodities (oil, industrial metals, some precious metals, food) is likely to take longer than expected and this should keep prices firm. Moreover, new risks are emerging on the supply side.

For instance, the lockdowns in China could add another element of supply disruption. The number of ships queuing up outside of Shanghai due to the covid lockdown is far higher than both last year and normal seasonal levels (see chart below). It is unclear what impact Shanghai’s lockdown will have on the port’s vessel queue, whether it will worsen the backlog or clear it. However, supply-chain managers around the world will need to start planning for knock on effects including on commodities prices.


Ships waiting to load or discharge at Shanghai – 2022 vs. recent history
Fonte
VesselsValue

Another upside risk for commodities prices is the fact that the EU could declare a full embargo on Russian oil after this weekend's French election. It seems that pressure from Brussels on Russia is increasing as they understand that despite their clear intentions to cripple Russian energy production, loadings of Russian oil have so far been surprisingly resilient, so much so that Russia's current account balance is at all-time highs. The following are various scenarios potentially considered by the Europeans:

1.  A full and immediate embargo: this is likely to hurt European consumers more than Russian producers in the near term. According to JP Morgan, a full, immediate ban would likely drive Brent crude oil prices to $185/ bbl as more than 4 mbd of Russian oil supplies would be displaced with neither room nor time to re-route them to China, India, or other potential substitute buyers;

2. Special taxes and;

3. Price caps on European imports of Russian oil.

The later two alternatives are plausible. Indeed, because the operational breakeven for Russian oil is less than $10/ bbl, Russian producers could likely still afford to continue to deliver oil to European consumers, even under tariffs of 90% or a price cap of $20/bbl. Either of these options may provide a politically-acceptable middle ground, allowing the EU to make a show of force while maintaining its Russian energy lifeline. The first option will put additional upward pressure on oil prices and the broader commodity spectrum.

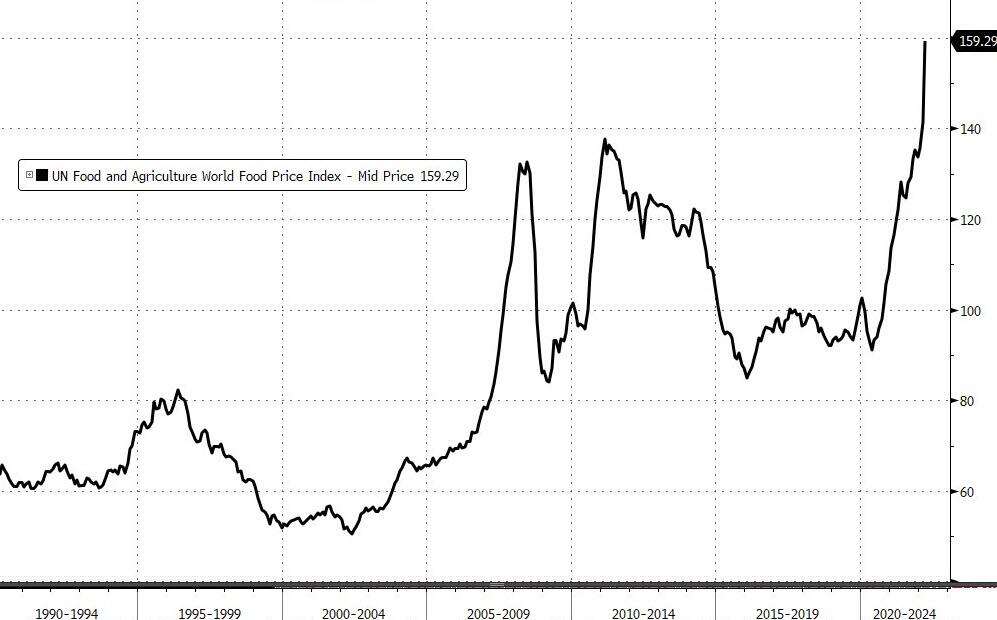
A specific area of stress within commodities is Food. Indeed, the Food and Agriculture Organization announced a few days ago that its FAO Food Price Index, which tracks monthly changes in the international prices of a "basket of commonly-traded food commodities" was up 12.6% in March vs. February (m/m). It's also 33.6% higher than it was last March (y/y).

The FAO says the war "spread shocks through markets for staple grains and vegetable oils." Russia and Ukraine collectively accounted for about 30% of global wheat exports and 20% of maize exports over the last three years, the organization said, with conflict-related export disruptions in both countries prompting a surge in global prices of wheat and coarse grain. The FAO Cereal Price Index was 17.1% higher in March than it was in February.

Another example of soaring soft commodities prices is corn. The global outlook for corn supplies has plunged since Russia's invasion of Ukraine began in late February. Ukraine supplies a fifth of the world's corn and could experience a 50% decline in output this year.

Soaring fertilizer costs have forced some farmers in the U.S. to increase plantings of soybeans this growing season versus corn as the crop requires fewer nutrients. Fertilizer prices are at record highs because of rising natural gas costs and Russia limiting fertilizer exports to 'unfriendly' countries. Russia is one of the biggest exporters globally -- the U.S. is a large importer of nitrogen and potash from Russia.

And the latest development pushing corn prices through the roof is the Biden administration's announcement of emergency measures last week to expand biofuel sales to curb soaring gasoline prices. The problem with this move is that the ethanol industry absorbs a larger share of the corn crop, which would curb supplies to the food industry. So ultimately, it would increase prices.

These examples show how commodities are interconnected. The rise of energy prices has some ripple effects on other commodities and means that the world is not just facing an oil supply shock as in the 70s but a broad commodity supply shock.

Global food prices have risen to levels even higher than those that led to the inflation riots of 2010/11, known as Arab Spring. Indeed, soaring food prices are creating new geopolitical risk such as social unrest not only in emerging markets but also developed markets, the rise of populism, massive immigration, etc. These risks need to be embedded into markets risk premium as well.

UN Food & Agriculture Food Price index
Fonte
Bloomberg

In terms of investment strategy, we are positive on commodities and hold a broad exposure to the asset class in our discretionary portfolios. We believe that commodities should be considered as a good hedge against inflation and we have been gradually rising our exposure.

The vast majority of global asset allocators are currently under-invested in commodities. Some research shows that the average asset allocation to commodities across multi- asset portfolios is around 1.5%. This leaves room for upward adjustment by global asset allocators, which will add further pressure to commodity prices.