Feature

August monthly review: 10 charts to remember

Lunedì, 09/05/2022

Most of the economic data released last month points to a slowdown in the economy. Central banks are choosing to ignore this in order to focus their efforts on fighting inflation amid an impending energy crisis of historic proportions. Here are 10 charts to help you look back on what happened in the markets during the month of August.

Lunedì 05/09/2022 - 17:12
Charles-Henry Monchau Chief Investment officer

Chart #1 - Central banks are becoming more hawkish

During the month of August, the major central banks (Fed, ECB, etc.) emphasised their determination to control inflation, despite the inherent risks to the growth outlook (see item n°2). This resolutely restrictive tone weighed on the performance of equity and bond markets (see articles n°6 and n°7).

The focus on fighting inflation at the expense of growth was made clear in Powell's Jackson Hole speech. The Fed Chairman also issued a clear warning to the American public: prepare for hard times. For Powell, reducing inflationary pressures will likely require an extended period of below-trend growth. While much of the inflation is supply-driven, it is the Fed's responsibility to reduce demand to restore price balance, he said.

Market expectations for US interest rates have been revised upwards throughout August. The yield curve now anticipates a 75 basis point rise in September, followed by a 50 basis point rise in November and a 25 basis point rise in December.

The tone adopted by the European Central Bank (ECB) has also become more hawkish. The market now assigns a probability of almost 100% for a 75 basis point hike in September, followed by another 50 basis points in October.

It is very rare to experience periods of monetary policy tightening when stock markets are falling. In the previous eight bear markets, the Fed's bias was decidedly expansionary (rate cuts, QE, etc.). This is not the case with the current bear market. The last historical equivalent (bear market with rate hikes) was in the early 1980s under Volcker.)

Fed policy during previous bear markets
Fonte
Charlie Bilello

Chart #2 - Global economy is cooling down

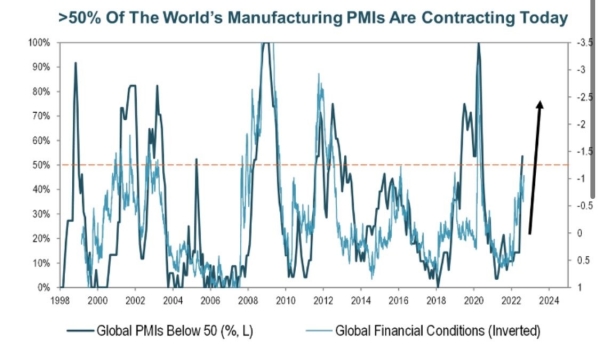
Most of the economic data released last month points to a slowdown in the economy. More than half of the world's manufacturing PMIs are currently contracting (<50). All indicators point to this percentage increasing (see below). However, macroeconomic figures have generally been somewhat better than expected, as shown by the economic surprise indices.

More than 50% of global manufacturing PMIs are now in
contraction
More than 50% of global manufacturing PMIs are now in contraction
Fonte
Pictet Asset Management)

Chart #3 - Inflationary pressures persist

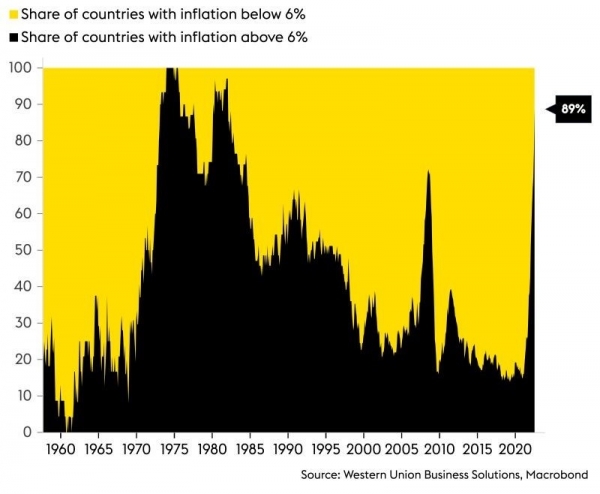
At the global level, we see that nearly 90% of the world's countries are experiencing inflation above 6%.

In the U.S., inflation appears to have passed its peak as the CPI rose 8.5% year-over-year in July, up from 9.1% in June. However, core inflation remains well above the Federal Reserve's target.

Eurozone inflation hit a record high: consumer prices rose 9.1% y/y in August, exceeding the 9% estimate. Core inflation jumped 4.3%, a new all-time high. It has probably not yet reached its peak, as the eurozone is in the midst of an energy crisis (see point 4), which is putting significant upward pressure on inflation.

In black share of countries with inflation above 6%
Fonte
Macrobond

Chart #4 - The European energy crisis

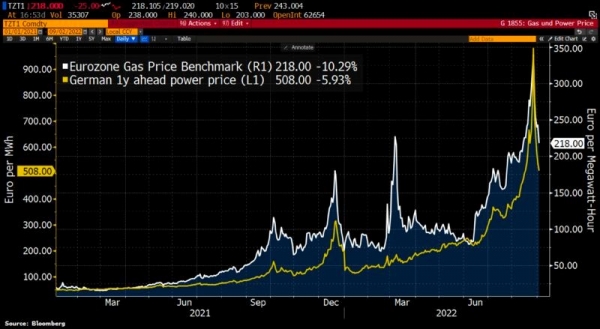
Europe continues to sink into an unprecedented energy crisis. In August, the one-year contract price for electricity in France exceeded €1,000 per megawatt hour for the first time. The German equivalent also reached a record high of €829 per megawatt hour. Of course, these prices are very volatile and indeed fell sharply in early September (see graph below). Moreover, many countries (France, Greece, etc.) are ready to put accompanying measures in place, particularly for the most financially strained households. Finally, we note that EU natural gas stocks reported in August were in line with the historical average, thanks to increased imports of liquefied natural gas (LNG) and the reactivation of coal-fired power plants.

However, a substantial reduction in gas flows through the Nord Stream 1 pipeline could keep European energy prices high and lead to a very complicated winter. In early September, Gazprom announced that it had "completely stopped" gas transport through Nord Stream until a previously undetected oil leak was rectified. This could take days... or months. This means that Europe will now be forced to rely even more on the much more expensive LNG sold from China. The risks of recession in the EU therefore remain high, as shown by the weakness of the euro, which has fallen to parity with the US dollar (see chart #10).

One-year electricity prices in Germany and gas prices in
the euro area
One-year electricity prices in Germany and gas prices in the euro area
Fonte
Bloomberg

Chart #5 - US company earnings remain resilient

In the second quarter of 2022, 75% of S&P 500 companies reported a positive earnings per share surprise and 70% of S&P 500 companies surprised positively on the revenue front (source: Factset). 

However, growth momentum is weakening. For the quarter, the aggregate earnings growth rate for the S&P 500 is 6.3%. This is the lowest earnings growth rate since Q4 2020 (4.0%).

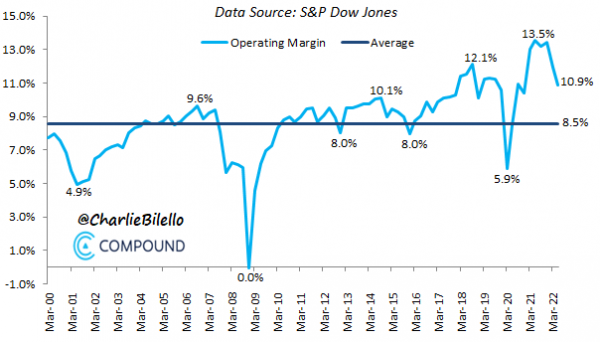
After reaching a record high of 13.5% in Q2 2021, S&P 500 profit margins have fallen back to 10.9% in Q2 2022 as sales growth has slowed and companies find it harder to pass on higher costs to their customers. In terms of valuation, we note that the S&P 500's 12-month price-to-earnings ratio is 16.7. This is lower than the 5-year average (18.6) and the 10-year average (17.0).

S&P 500 Operating Profit Margins
Fonte
Charlie Bilello

Chart #6 - The summer equity rally came to an end

Against this backdrop of global economic uncertainty and monetary tightening, global equity markets were down in August, ending the rebound that began in July.

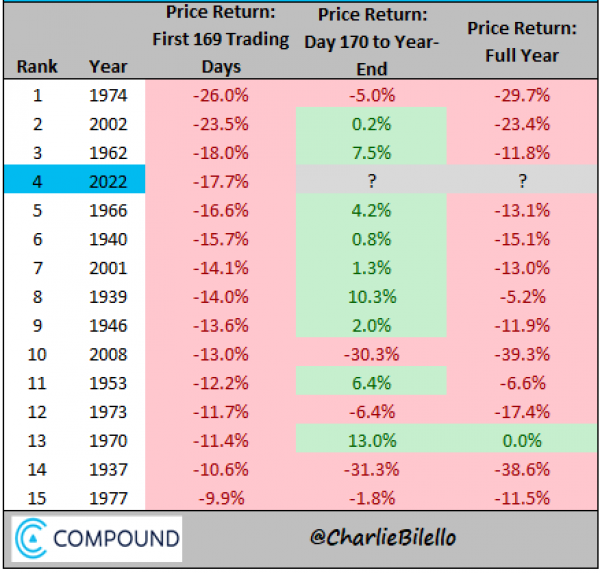
The MSCI World Index fell by 4.1% over the month. European equity markets fell the most, with the MSCI Europe ex UK down 4.7%.  In the US, the S&P 500 was down 4.1%. The S&P 500 lost 17.7% in the first 169 trading days of 2022, the fourth worst start to a year in history.

In the rest of the world, Japan continued to outperform, with a monthly gain of 1.2% (in yen) for the Topix index. Emerging markets rose 0.5% despite China's difficulties with its real estate sector and the heat wave and drought.

S&P 500 worst performance through 169 trading days
Fonte
Charlie Bilello

Chart #7 - The first bear market for global bonds in a generation

In the bond markets, rising sovereign yields led to negative returns across all sectors. Emerging markets and European high yield bonds outperformed, although their monthly performance remained negative.

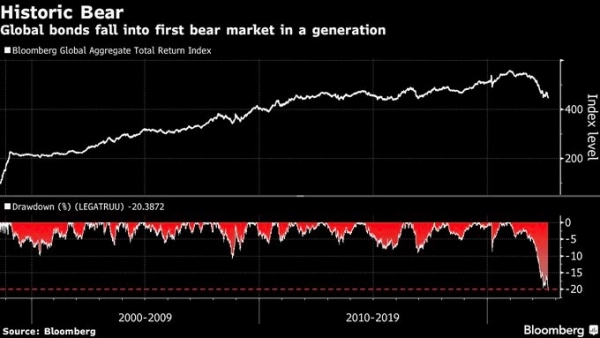
We note that global bonds are now in their first bear market in a generation. Indeed, the Bloomberg Global Bonds Index has fallen by 20% since its peak in January 2021. This is also the longest US bond market decline in history (25+ months) and the largest decline (-12.3%) since 1980.

Global bonds in « bear market »
Fonte
Bloomberg

Chart #8 - Nowhere to hide

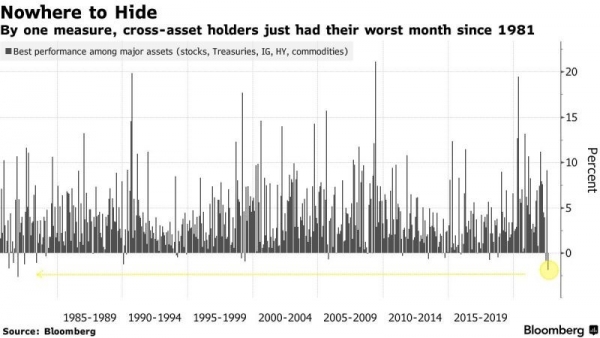
All asset classes (equities, Treasuries, investment grade, high yield, commodities) fell last month, the first time since '81. Indeed, even commodities fell, with WTI crude oil down 10% and gold down nearly 5%.

S&P 500 worst performance through 169 trading days
The worst month for cross-assets investors since 1981
Fonte
Bloomberg

Chart #9 - Annus horribilis for « 60/40 » portfolios

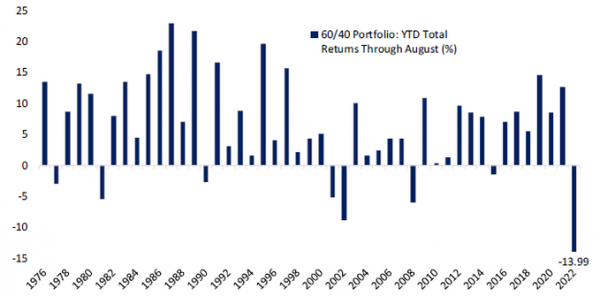
With bond and equity markets declining simultaneously, 2022 remains a very difficult year for multi-asset class portfolios. A 60-40 portfolio (US equities/US bonds) is off to its worst start on record.

Annual performance for 60/40 portfolios
Fonte
Bespoke

Chart #10 - US dollar at a 20-year high

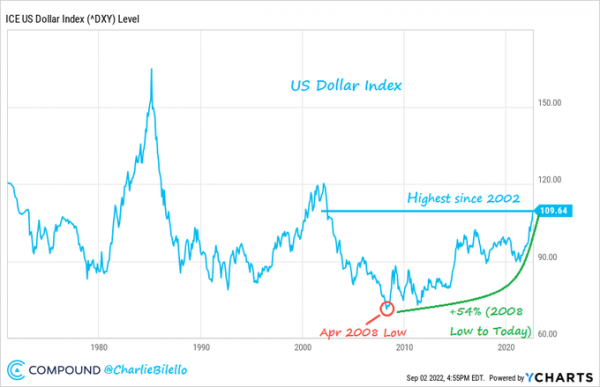
The US dollar index ($DXY) is at its highest level in 20 years (June 2002), up 54% from its 2008 low. The euro briefly fell below parity due to the energy crisis in Europe. While the dollar is soaring, Asian currencies are now at the COVID and 2008 lows. Meanwhile, the yen is experiencing its biggest decline since the Asian financial crisis.

In August, sterling suffered its biggest monthly fall (-4.5%) against the dollar since the Brexit referendum, with political uncertainty and inflation weighing heavily on the British currency. A new Prime Minister will be appointed in September following a ballot among members of the Conservative party, leading to uncertainty about the outlook for fiscal policy. The market now expects the energy crisis to drag the UK economy into recession.

Bloomberg dollar index (DXY)
Fonte
Charlie Bilello