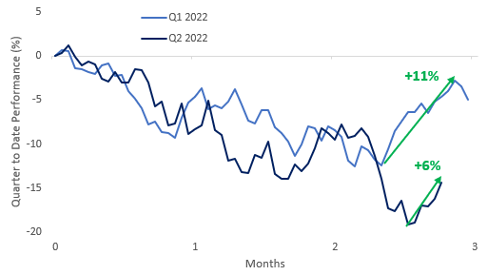
The S&P 500 gained over 6% in what was its second best week of 2022. As a reminder, the equity markets had experienced a late Q1 rally, when the S&P 500 appreciated 11% in a matter of days during the second half of March. This time, the end-of-quarter rally took longer to materialize. But since June 16th, the S&P 500 is up 6%. With four sessions left until the end of June, will the end-of-quarter rally be on par with Q1?
Feature
The week in seven charts
Lunedì, 06/27/2022The European Union is facing a serious energy crisis
Half of all commodities now in bear market, the EU braces for a cold winter and the S&P 500 recorded its 2nd-best week of 2022 as disinflationary forces gather steam & Fed tightening expectations recede. Each week, the Syz investment team takes you through the last seven days in seven charts.

Charles-Henry Monchau
Chief Investment officer
Chart #1 — An end of the quarter rally?
S&P 500 Quarter to Date Performance (%): Q1 vs. Q2 2022
Fonte
Bespoke
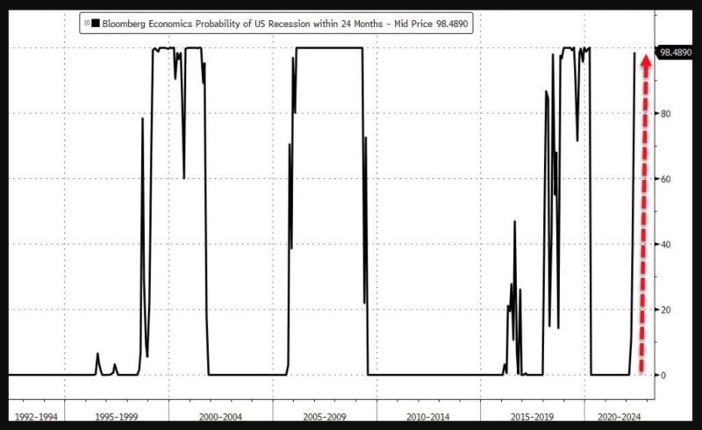
Chart #2 — US recession risk is on the rise
It may seem counterintuitive, but one of the main reasons for the market's rise in recent days is the deterioration of macroeconomic figures. Indeed, this bad news is interpreted as a positive development by investors as it suggests a moderation of inflationary pressures and therefore of the Fed's rate hike cycle (see chart #3).
The probability of a recession in the US (and other developed countries) is on the rise as shown in the chart below. Bloomberg Economics even mentions a near- guaranteed recession. This is not a meaningless hypothesis, at least if we want to talk about a "technical" recession (i.e. two consecutive quarters where GDP is down on a sequential basis). Indeed, US GDP growth in Q1 was -1.3%. Based on the Atlanta Fed's projections, the U.S. economy is expected to stagnate or contract again in Q2. We are therefore very close to a so-called "technical" recession. But the biggest risk for the markets would be a severe and long-lasting recession.
Probability of a US Recession within 24 months – Bloomberg Economics
Fonte
Bloomberg
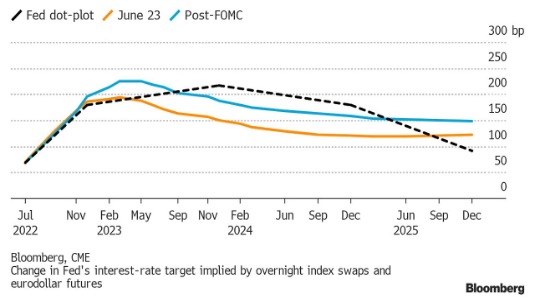
Chart #3 — Fed rate hike expectations moderate
As a result of the disappointing macroeconomic figures, the market is lowering its expectations for the magnitude of the monetary tightening cycle in the United States.
Market expectations for US inflation (5-year breakeven inflation) have fallen to 2.69%, their lowest level of the year. Investors now expect the Fed to end its tightening cycle much sooner than expected, most likely around the mid- term elections.
The market now expects the rate hike cycle to end in March 2023
Fonte
Bloomberg
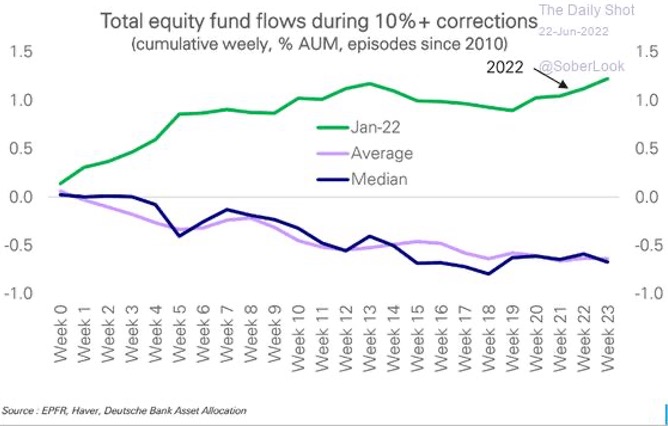
Chart #4 — Still no sign of capitulation in the equity markets
During market phases characterized by significant declines, investors often seek to determine the moment when markets "capitulate", i.e. a situation where selling flows "run out" and which constitutes the preamble to a sustainable market rebound.
What do the various sentiment indicators say? Some of them clearly show an oversold situation, but others are much less convincing. For example, US fund flows do not show a market capitulation. On the contrary, investors have been accumulating equity funds during the downturn. An attitude that suggests that we may not yet have witnessed the real stress phase that normally characterizes the end of the bear market.
Fonte
DB, The Daily Shot
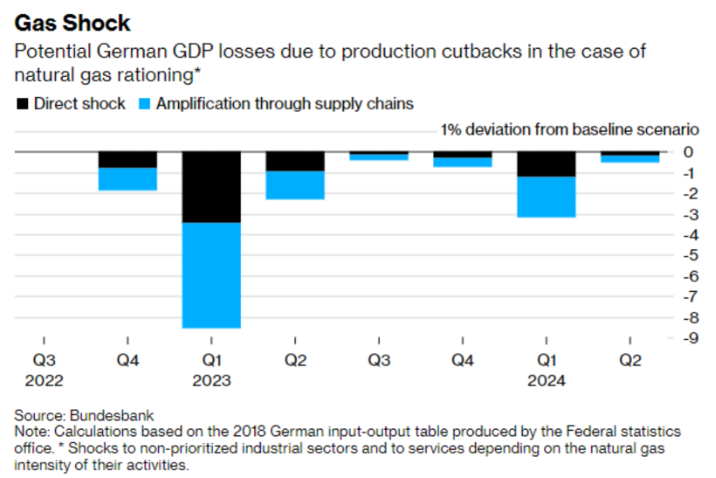
Chart #5 — The European Union is facing a serious energy crisis
The European economy is on the verge of stagflation. In May, the producer price index in Germany reached 33.6% on a 12-month rolling basis, its highest figure since statistics began. One of the main reasons for this was the 90.4% rise in electricity prices. These figures bode ill for the upcoming inflation figures. At the same time, business confidence surveys continue to deteriorate, which signals poor growth figures for the coming months.
And the worst may be yet to come. The European Union will surely face a serious energy crisis. Many European countries are very (too) dependent on Russian gas. The latter is Putin's best weapon. The Nordstream 1 gas pipeline will be taken out of service by Russia on July 11 for "maintenance". Putin's objective is to prevent Europe from taking advantage of the summer to store as much gas as possible before the next winter, even though the level of stocks is already very low. As a result, Germany has raised its alarm level to stage 2 and is preparing to implement a number of emergency solutions, such as an increased use of coal and rationing, with the well-known consequences for industrial production. The impact on German (and therefore European) growth this winter could be very significant; one study projects a 9% drop in German GDP in the first quarter of 2023.
The International Energy Agency has warned the EU to prepare immediately for a complete shutdown of Russian gas exports this winter, urging governments to take measures to reduce demand and keep aging nuclear power plants open.
Fonte
Bloomberg, Bundesbank
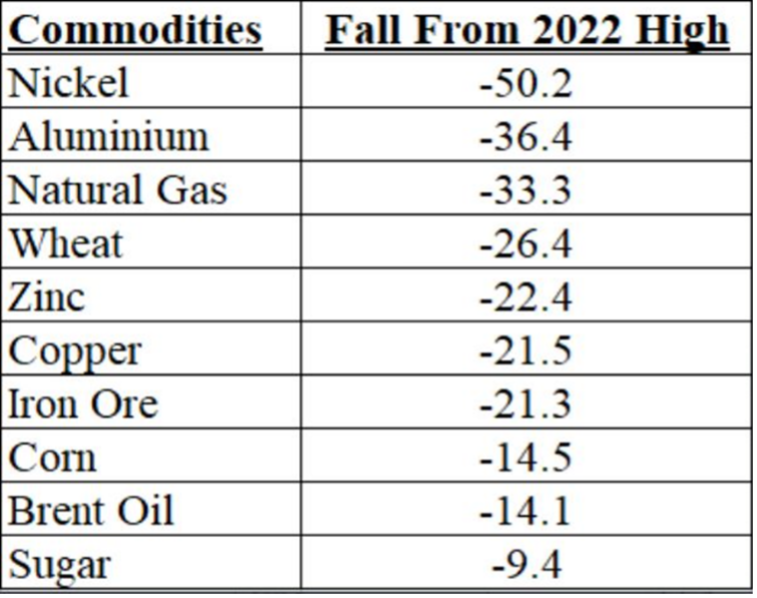
Chart #6 — More than 50% of commodities are in bear market
The major central banks now have a very clear plan: rapid and aggressive monetary tightening to put pressure on demand in order to reduce rising inflation. These demand pressures are having an impact on commodity prices. More than half of all traded commodities are now in a bear market (i.e. down more than 20% from their highs). A decline that could help stem inflationary pressures, even if oil prices remain relatively high.
Fonte
TME, Twitter
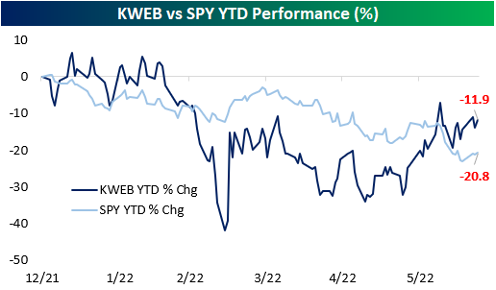
Chart #7 — China Internet stocks have been strongly outperforming the S&P 500 recently
Chinese stocks have performed positively again this past week, thanks in part to hopes for a recovery after President Xi Jinping pledged to deploy more measures to support the economy and minimize the impact of COVID-19.
Year-to-date, the KraneShares China Internet ETF (KWEB) is significantly outperforming the S&P 500 SPY ETF (-11.9% vs. -20.8%) after rebounding 50% from its early March low. Since the end of May (5/24), KWEB has gained 29.7%, compared to a 4.5% decline for SPY.
Fonte
Bespoke
Disclaimer
Il presente documento di marketing è stato redatto dal Gruppo Syz (di seguito denominato «Syz»). Esso non è destinato alla distribuzione o all’utilizzo da parte di persone fisiche o giuridiche cittadini o residenti in uno Stato, un Paese o una giurisdizione le cui leggi applicabili ne vietino la distribuzione, la pubblicazione, l’emissione o l’utilizzo. Spetta unicamente agli utenti verificare che siano legalmente autorizzati a consultare le informazioni nel presente. Il presente materiale ha esclusivamente finalità informative e non deve essere interpretato come un’offerta o un invito per l’acquisto o la vendita di uno strumento finanziario, o come un documento contrattuale. Le informazioni fornite nel presente non sono intese costituire una consulenza legale, fiscale o contabile e potrebbero non essere adeguate per tutti gli investitori. Le valutazioni di mercato, le durate e i calcoli contenuti nel presente rappresentano unicamente stime e sono soggetti a variazione senza preavviso. Si ritiene che le informazioni fornite siano attendibili; tuttavia, il Gruppo Syz non ne garantisce la completezza o l’esattezza. I rendimenti passati non sono indicativi di risultati futuri.