As expected, the U.S. Federal Reserve raised policy rates by 75 basis points, which is its most aggressive move since 1994. But the Fed was not the only central bank to take center stage last week. Of course, monetary authorities in countries whose currencies are pegged to the dollar raised their rates in the process (e.g. Saudi Arabia). But the most unexpected move came from the Swiss National Bank, which raised rates by 50 basis points, its first rate hike since 2007. The Bank of England also made an upward adjustment of 25 basis points. At the same time, the European Central Bank held an unscheduled meeting and indicated that it would take action to stem the widening of yield spreads between member states' sovereign bonds. Elsewhere in the world, Brazil raised its policy rate by 50 basis points and Taiwan by 12.5 basis points. The only central bank to remain inactive was the Bank of Japan, which, despite inflationary pressures, decided to maintain its negative rate policy and the use of yield curve controls to suppress any rise in long-term yields. As the chart below shows, the rate hike is global, but there are still large disparities in real rates.
The week in seven charts
Lunedì, 06/20/2022Central banks around the world are stepping up their game
Last week was all about central banks and their continued efforts to curb inflation. Multi-asset management is still a head-scratcher and crypto-assets’ crash intensified. Each week, the Syz investment team takes you through the
last seven days in seven charts.

Chart #1 - A big week for central banks
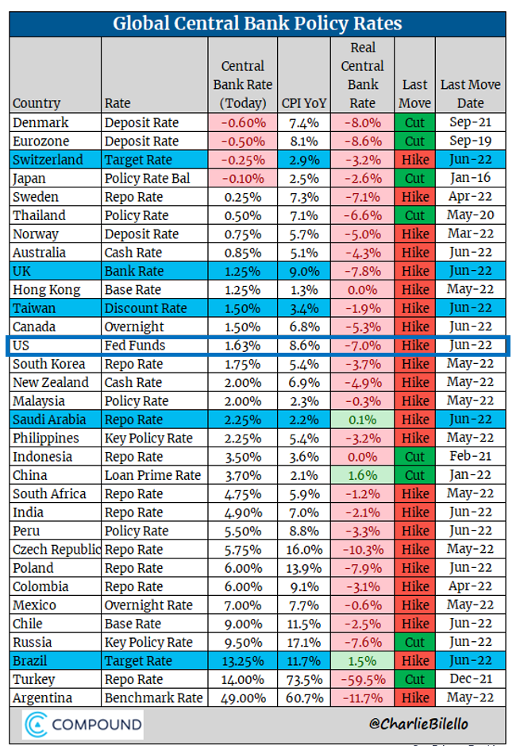
Chart #2 - Will the SNB start to sell US stocks?
The Swiss National Bank unexpectedly raised rates by 50 basis points to curb inflation, seizing a window of opportunity to move closer to positive rates. Not only did the SNB raise the key interest rate, but it also warned that it might sell some of the securities on its balance sheet. Indeed, the SNB has diversified its foreign exchange reserves into equities and corporate bonds over the years and this trend may soon be reversed. The goal is to sell U.S. stocks and use the dollars to buy Swiss francs, making the Swiss currency stronger and thus fighting inflation.
The SNB currently holds about $177 billion in U.S. equities, concentrated mainly in large technology stocks. Indeed, the SNB is one of the largest holders of Apple, Microsoft and Amazon shares in the world. Will we see more selling pressure on the Nasdaq?
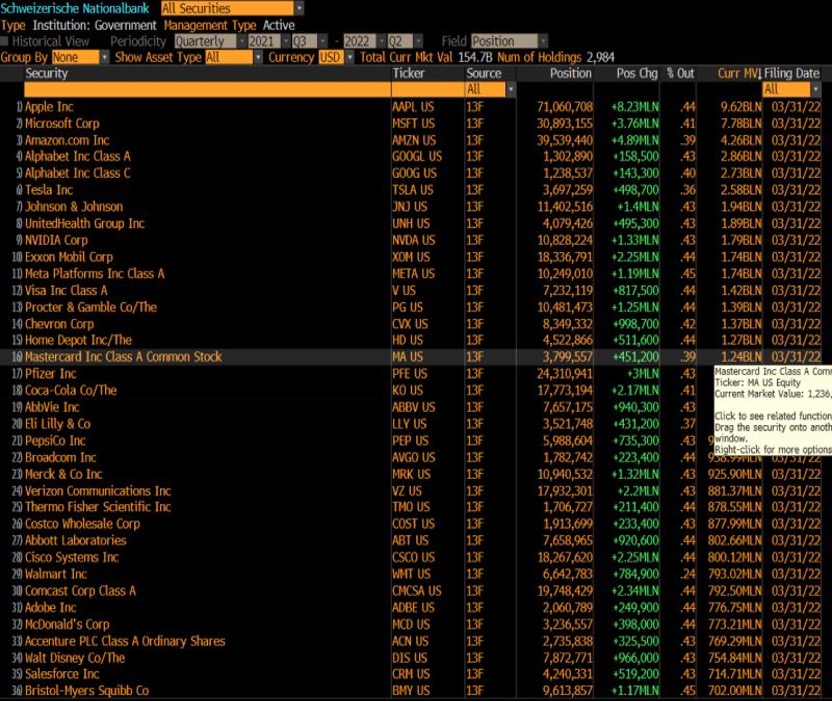
Chart #3 - The Dow Jones ends in the red again
The Fed's monetary tightening is sparking recession fears and sent stocks tumbling for a second straight week. The S&P 500 Index posted its worst weekly decline since March 2020 and entered a bear market, ending the week nearly 24% below its January peak. As for the Dow Jones Industrial Average, it has recorded 11 weeks of declines out of the last 12, a streak that has never been seen before. While U.S. stocks rallied after the FOMC decision on Wednesday, the mood on Wall Street deteriorated on Thursday due to weak macroeconomic numbers. Indeed, several reports (housing starts, building permits) indicated that the U.S. housing sector was already feeling the impact of the Fed's tightening and the surge in mortgage rates. In addition, U.S. retail sales were lower than expected, while weekly jobless claims were higher than expected.
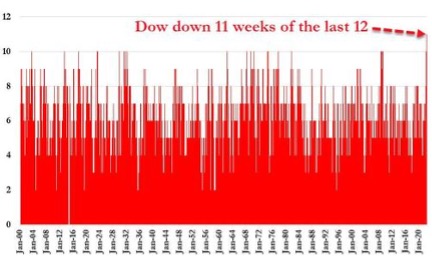
Chart #4 - Times remain very difficult for multi- asset investing
Stocks were not the only asset class to suffer over the past week. Inflation and interest rate fears pushed the 10-year U.S. Treasury yield to 3.49% on Tuesday (its highest level in more than a decade) before falling back to 3.24% by the end of the week. Most fixed income segments were down for the week.
After some divergence, the return to a simultaneous decline in stocks and bonds makes multi-management very complicated. Indeed, the positive correlation between the two asset classes cancels the traditionally beneficial effects of diversification. A 60/40 (stock/bond) U.S. index is down nearly 20% from its historical highs, with the magnitude of the decline almost equally divided between stocks and bonds.

Chart #5 - «Smart money» is buying US stocks during the downturn
Several indicators suggest that U.S. stocks are very clearly in oversold territory. Another indicator worth noting is that Bloomberg's SMART Money Flow has soared as part of this pullback in stocks, creating a de facto positive divergence. The Smart Money Flow index is calculated using a formula that measures Dow Jones stock during two periods: shortly after the open and in the last hour. The first few minutes represent emotional, greed and fear-driven buying by retail investors based on good and/or bad news. The last hour is often dominated by institutional investor buying or selling.
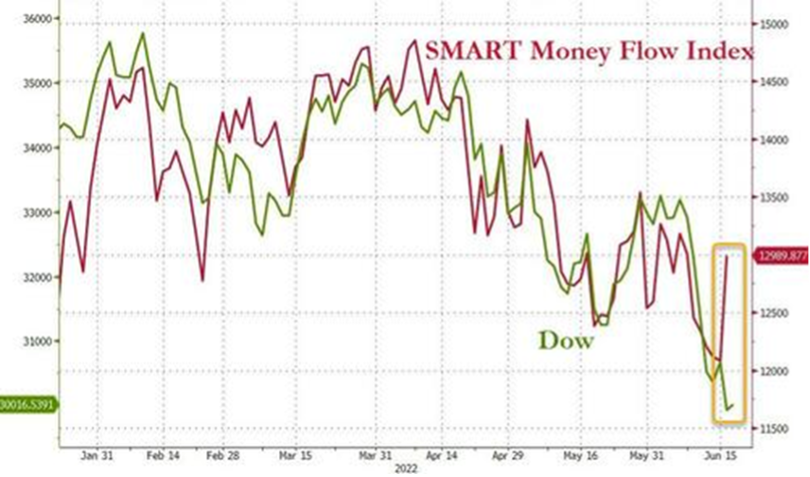
There is a caveat though. The Smart Money Flow Index can give false signals in a bear market, as short sellers tend to close out their positions at the end of the trading day (i.e. in the last 30 minutes), briefly driving the market higher.
Chart #6 - The credit market at the breaking point?
High yield bond markets continued to fall last week, with the High Yield Corporate Bond ETF (HYG) falling to its lowest level since March 2020. At that time, the Fed had stepped in to support the debt market and bought bonds for considerable amounts. This is not the priority of the monetary authorities at the moment, as the Fed now seems determined to fight inflation even at the expense of the financial markets. The lack of a Fed put is perhaps the biggest stress on the markets right now.
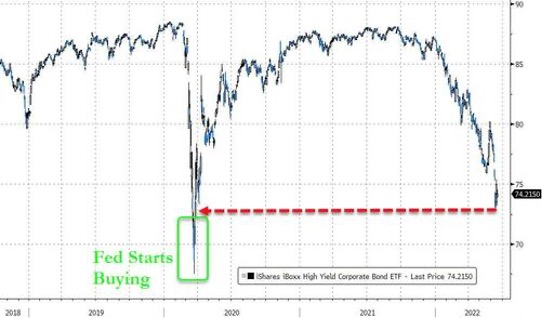
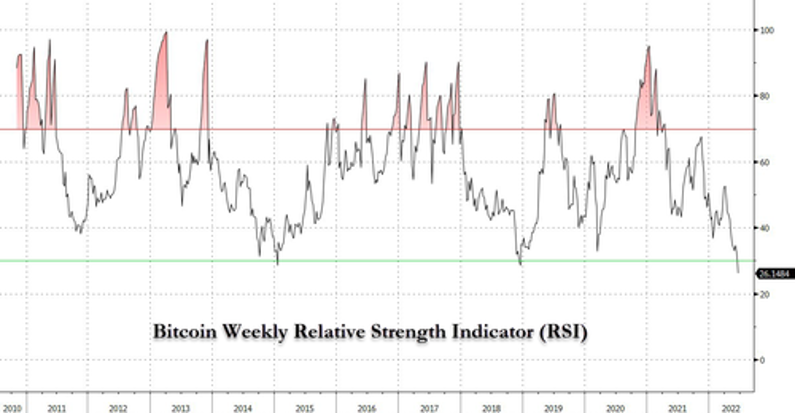
Chart #7 - Is the bitcoin oversold?
Bitcoin (-30%) had its worst week since March 2020 to reach the psychological threshold of $20,000. An important support that did not hold over the weekend as Bitcoin even fell below $20,000 due to cascading forced liquidations.
Ethereum saw an even bigger drop, losing 35% last week alone. At issue is the liquidity crisis that is currently plaguing several "crypto lenders".
With regards to Bitcoin, it would appear that the leading cryptocurrency has never been so oversold (see RSI indicator below).