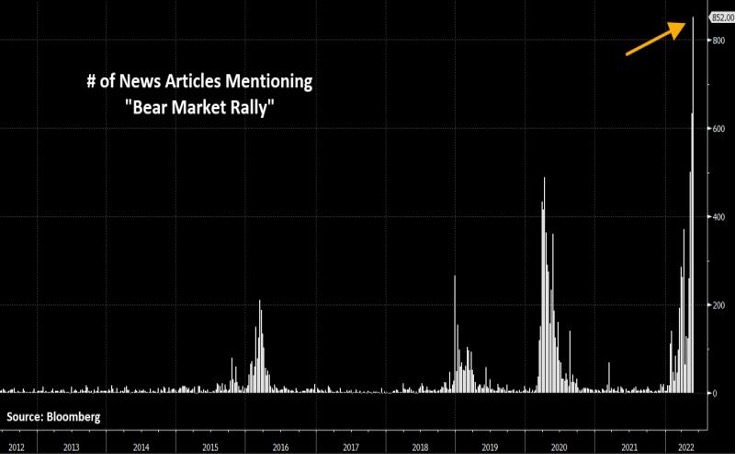
Global equities gave up some of the previous week's strong gains. Investors remain sceptical about the Fed's ability to moderate inflation without pushing the US economy into recession. It is interesting to note that the idea of a "bear market rally" appears to be relatively consensual, as evidenced by the number of press articles mentioning the term. The consensus is very rarely right at major market turning points. How can we interpret such a strong consensus? That the bear market rally is already over (in other words that it didn't really happen)? Or that the bear market is now behind us (we are at the beginning of a new bull market)?
Feature
The week in seven charts
Martedì, 06/07/2022Is the « bear market rally » already coming to an end?
European inflation rises and inflation surprises seem to have peaked in the US, while JPM CEO speaks of “impending hurricane” for the economy. Each week, the Syz investment team takes you through the last seven days in seven charts.

Charles-Henry Monchau
Chief Investment officer
Chart #1 - Is the « bear market rally » already coming to an end?
Fonte
Bloomberg
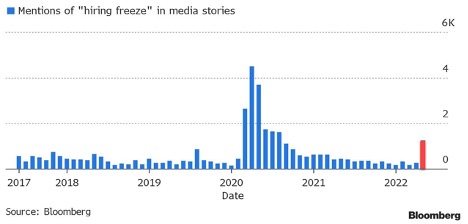
Chart #2 - The end of the upturn in the US labour market?
JP Morgan CEO Jamie Dimon downgraded his economic outlook from "clouds on the horizon" to an "impending hurricane". Following this, Goldman Sachs chairman John Waldron noted that "the shocks to the system are unprecedented" while Elon Musk warned that he had a "very bad feeling" about the economy, ordering a hiring freeze and warning of future job cuts at Tesla. The warning signs in the US labour market are not limited to these three major companies, as the number of news articles mentioning a "hiring freeze" has recently reached a level not seen since the early months of the pandemic in 2020. Yet the May US employment data released last week was rather reassuring: 390,000 jobs were created in the month and the unemployment rate remained unchanged at 3.6%. Average hourly earnings rose by 0.3%, a figure that was welcomed by economists: it allows employees to offset some of the rise in prices without signaling a further overheating of wages.
Fonte
Bloomberg
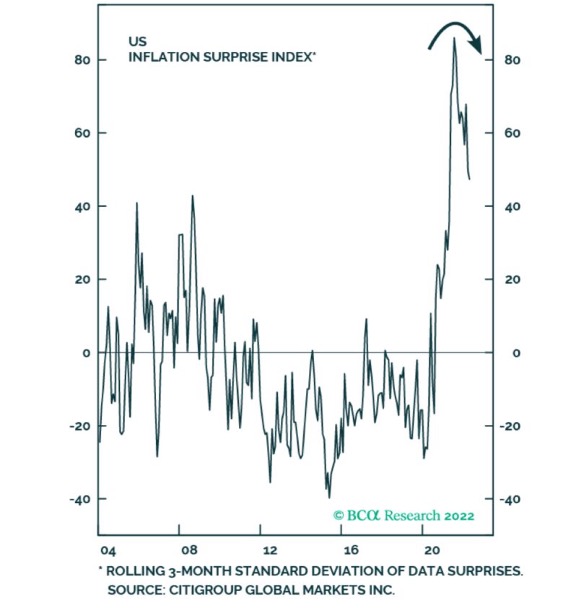
Chart #3 - US inflation no longer surprises on the upside
There are always two levels to consider with US figures: the absolute level and the level relative to expectations. Hence the usefulness of constructing economic "surprise" indices. When the figures published are better than expected, we speak of positive surprises. The opposite is called a negative surprise. As the chart below shows, after months of strong growth, the US inflation surprise index has just turned around. Inflation remains at very high levels but is now below market expectations. One explanation: US wage growth probably peaked initially but has since moderated and should de facto ease the pressure on inflation.
Fonte
BCA
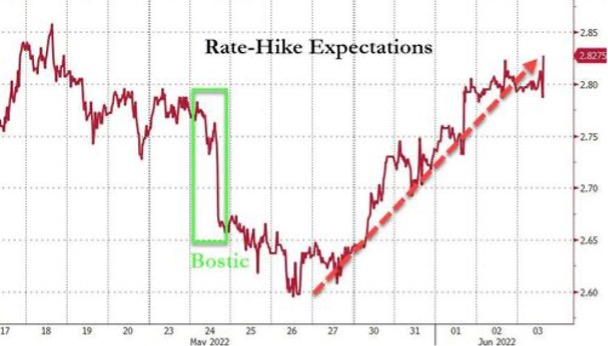
Chart #4 - Fed turns hawkish again
In between monetary policy meetings, members of the Federal Reserve have a habit of speaking out. While the Atlanta Federal Reserve President had toned down rate hike expectations the week before, the rhetoric this past week was geared towards a decidedly restrictive monetary policy. The market adjusted rate expectations upwards for this year. As a result, US Treasury yields resumed their upward path, with the medium-term portion underperforming (+23 basis points for 5-year yields) compared to the long basis points for the 30-year).
Fonte
Bloomberg, www.zerohedge.com
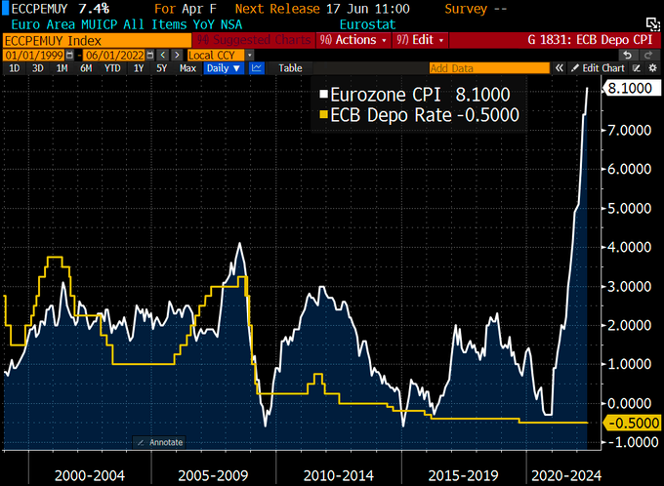
Chart #5 - European inflation rises sharply; peripheral bonds spreads widen
Eurozone inflation reached 8.1% in May, the highest level ever, even though the European Central Bank is still holding interest rates at negative levels. Such a dichotomy between inflation rates and monetary policy has probably never been seen in developed economies. However, the market is anticipating the first steps towards the normalisation of monetary policy this year (a rise of more than 110 basis points currently expected by the bond yield curve). Market participants also anticipate the beginning of stress on "peripheral" zone bonds (Italy, Spain, Greece, etc.) Indeed, Italian 10-year yields jumped last week to 3.24%, their highest level since 2018, while Spanish 10-year yields reached their highest level since 2015.
Fonte
Bloomberg
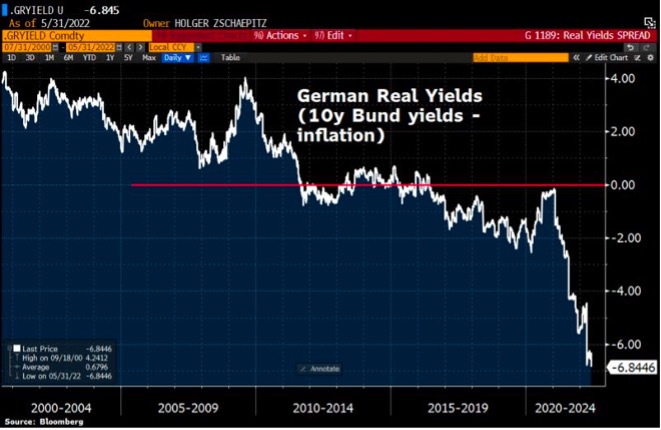
Chart #6 - Financial repression is alive and well in Germany
It's not just peripheral bond yields that are tightening. Last week, German 10-year yields reached 1.24%, their highest level since 2014. Despite this rise, the real "Bund" yield (yield to maturity of the German 10-year - the inflation rate) has fallen to an all-time low. Indeed, the acceleration of inflation in Germany (7.9% in May, its highest level since 1952) is outpacing the rise in nominal bond yields. Real yields have been in negative territory for 73 months in a row.
Fonte
Bloomberg
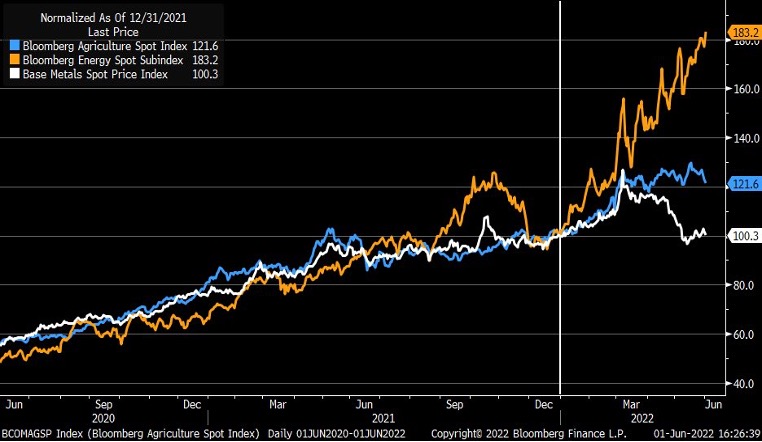
Chart #7 - Divergence in the commodity bull market
Commodities continue to outperform global equities significantly. In relative terms, the S&P 500 Index relative to the CRB Commodities Index is at its lowest level in five years. But since the beginning of the year, there has been a significant divergence in performance between energy (orange line), agricultural commodities (blue) and metals (white) ...
Disclaimer
Il presente documento di marketing è stato redatto dal Gruppo Syz (di seguito denominato «Syz»). Esso non è destinato alla distribuzione o all’utilizzo da parte di persone fisiche o giuridiche cittadini o residenti in uno Stato, un Paese o una giurisdizione le cui leggi applicabili ne vietino la distribuzione, la pubblicazione, l’emissione o l’utilizzo. Spetta unicamente agli utenti verificare che siano legalmente autorizzati a consultare le informazioni nel presente. Il presente materiale ha esclusivamente finalità informative e non deve essere interpretato come un’offerta o un invito per l’acquisto o la vendita di uno strumento finanziario, o come un documento contrattuale. Le informazioni fornite nel presente non sono intese costituire una consulenza legale, fiscale o contabile e potrebbero non essere adeguate per tutti gli investitori. Le valutazioni di mercato, le durate e i calcoli contenuti nel presente rappresentano unicamente stime e sono soggetti a variazione senza preavviso. Si ritiene che le informazioni fornite siano attendibili; tuttavia, il Gruppo Syz non ne garantisce la completezza o l’esattezza. I rendimenti passati non sono indicativi di risultati futuri.