Focus

The week in seven charts

Martedì, 05/10/2022

Rate hikes abound across the world, following in the Fed’s footsteps. Volatility is peaking, tech stocks aren’t out of the woods and the US administration’s shrinking oil reserves are pushing the black gold’s prices ever higher. Each week, the Syz investment team takes you through the last seven days in seven charts.

Martedì 10/05/2022 - 09:29
Charles-Henry Monchau Chief Investment officer

Chart #1 — A busy week for central banks

The U.S. Federal Reserve was of course the center of attention last week. As expected, the Fed raised its key interest rates by 50 basis points.

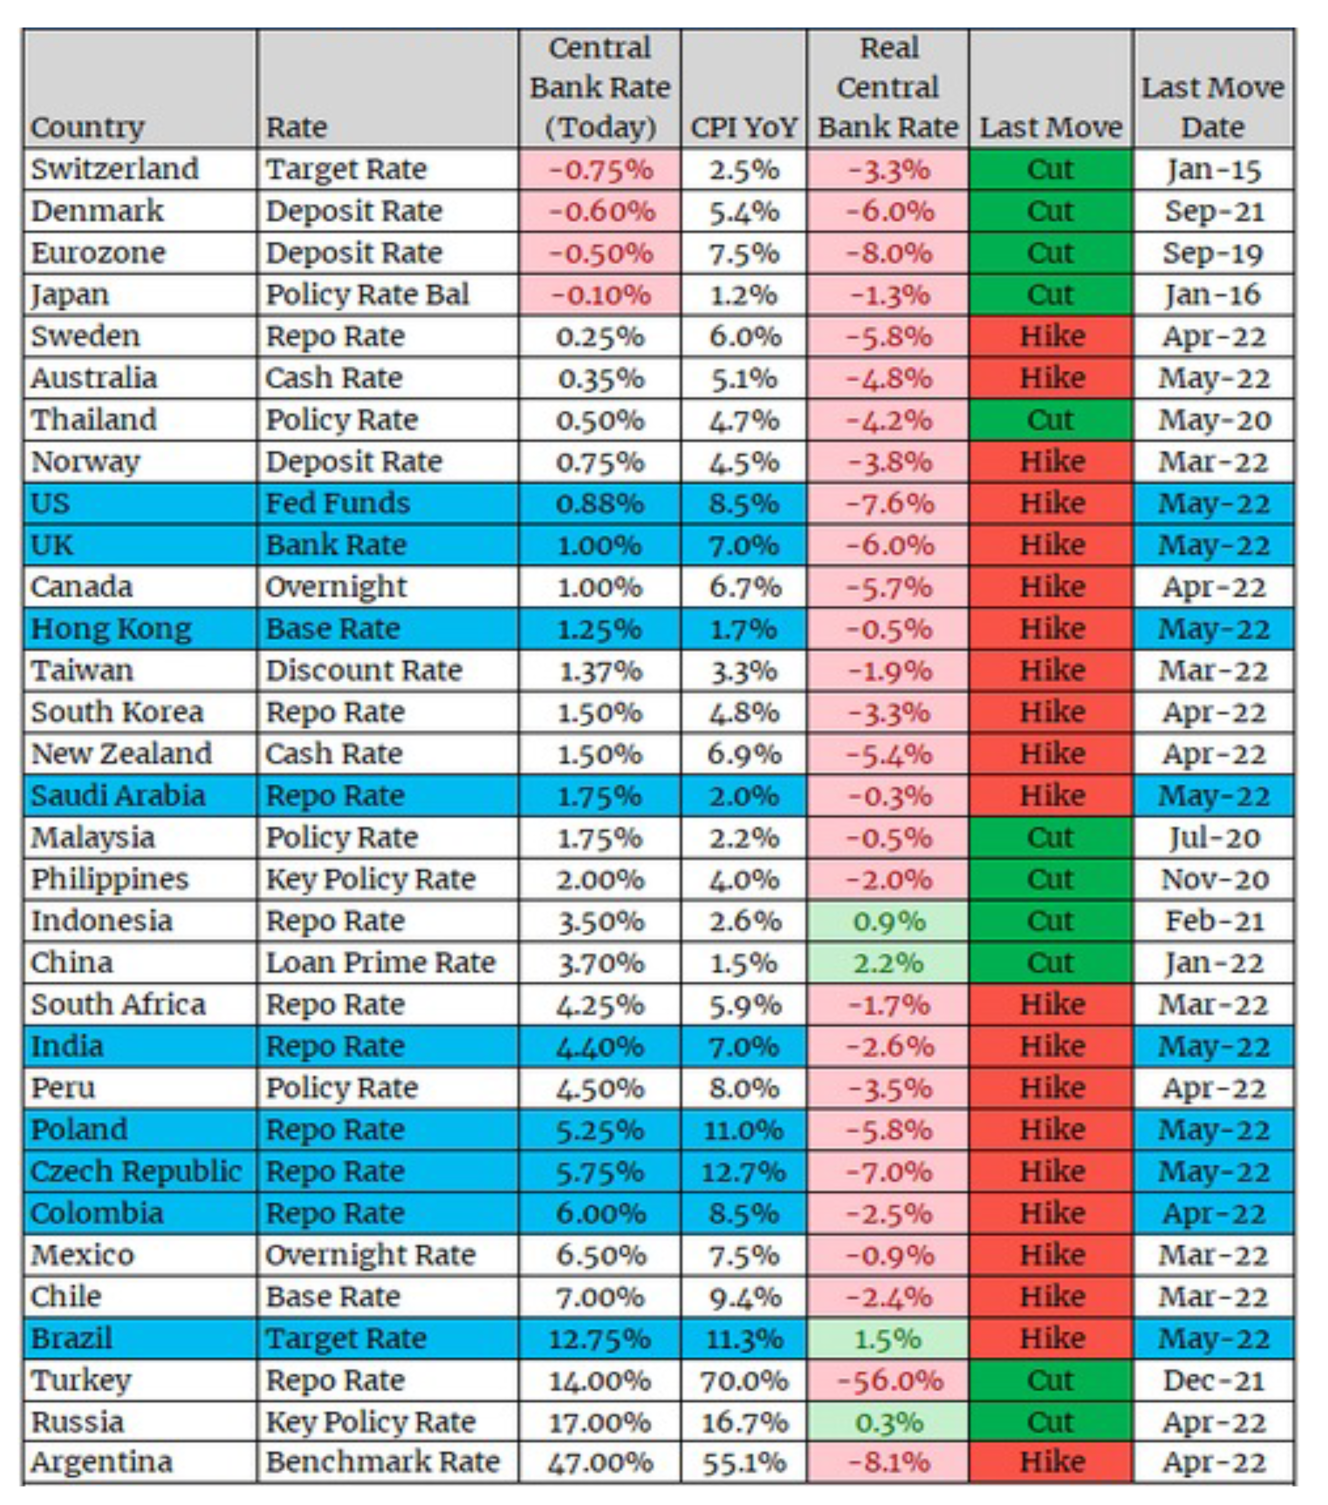
But the U.S. monetary authorities were not the only ones to act. Indeed, countries whose currencies are pegged to the U.S. dollar are under a virtual obligation to replicate any rate move by the Fed. Not surprisingly, the central banks of Hong Kong, Saudi Arabia, the United Arab Emirates followed, among others, the Fed's lead by raising their own rates.

The Fed's monetary tightening policy is pushing up the greenback, thereby increasing the cost of dollar-denominated loans and the price of imported commodities traded in dollar. Some developing countries are therefore trying to halt the depreciation of their currency against the dollar and are resorting to monetary tightening to do so.

India raised its rates by 40 basis points last week, Poland and the Czech Republic by 75, Brazil and Colombia by 100.

As for the British central bank, which now fears double-digit inflation, it raised rates by 25 basis points.


Global Central Bank Policy Rates
Fonte
Charlie Bilello

Chart #2 — A roller-coaster week for US equities

An historic event took place a few days ago in the U.S. stock market: after a 3% rally on Wednesday, the S&P 500 fell by 3.6% the next day. Since 1970, such a drastic reversal of the trend has occurred only 8 other times. What happened?

On Wednesday, the conference call held by Jerome Powell right after the Fed's decision was interpreted as reassuring by the market, as the Fed Chairman sent the message that an even bigger rate hike (75 basis points versus 50) was not on the agenda for the next Fed meeting (June).

On Thursday however, the release of higher U.S. unit labor costs than the market was expecting caused this sharp reversal.


Distribution of S&P 500 Daily Returns Since 1970
Fonte
Bloomberg

Chart #3 — The bloodbath continues on technology stocks

Years of accommodative monetary policy have benefited the tech sector. Conversely, the ongoing tightening is weighing on their performance. The Nasdaq is now down more than 25% from its highs and was under pressure again last week. Of the 192 major technology and communication services stocks, 167 (87%) are down this year. The one notable exception? Twitter.

It was another complicated week for cryptocurrencies, whose correlation with the Nasdaq seems to remain relatively high...

Tech & Media Stocks are having a terrible time in 2022
Fonte
Chartr, FinViz

Chart #4 — US 10 year yield broke the 3.0% key level

Change of trend on the American bond markets: the front part of the curve (short durations) saw its yields remain stable or even fall on the 2-year following the Fed's decision. On the other hand, yields on the long end of the curve have risen dramatically, with the US 10-year even breaking the psychological 3% barrier. Note that the entire yield curve starting at 3-year maturities is trading above 3.00%.

The break out Chart?
Fonte
The Market Ear, Refinitiv.

Chart #5 — Volatility is on the rise across all asset classes

It's a fact: volatility is back this year in the equity, bond and commodity markets. Of course, it is only natural that markets become more volatile during periods of monetary tightening. However, the loss of credibility of central banks may also be at play here. The good news is that Jerome Powell is (finally) aware of this. Part of his speech on Wednesday night seemed to be not only aimed at restoring confidence among investors but also among US households.

Volatility indices
Volatility indices
Fonte
www.zerohedge.com, Bloomberg

Chart #6 — The come-back of "EU Periphery bonds stress"?

Let's now turn our attention to Europe. Eurozone bond market yields mostly followed the direction of their American counterparts last week: the German Bund reached 1.13%, its highest level since 2014. Other sovereign bonds followed suit, and even more so, as the yield spread between the so-called "peripheral" European countries (Italy, Spain, Greece, etc.) and those of Germany continues to widen, a sign of increased stress levels among investors, some of whom fear that the very weakening of European growth and the euro against the dollar could renew questions about the sustainability of the European Union.

Spread of 10-year sovereign bonds over Bunds, in bps
Fonte
Robin Brooks

Chart #7 — Oil prices keep moving higher

Energy prices continue to rise, with known consequences on inflation and consumer purchasing power. Oil was one of the few financial assets to rise last week. The stalemate in the crisis with Russia is not helping. But a decision by the Biden administration also helped push up the price of black gold last week. Just a month and a half after President Biden unveiled his plan to release millions of barrels of oil from the U.S. Strategic Petroleum Reserve, CNN reported that the U.S. administration is now planning to replenish the dwindling stockpile of this emergency reserve. The price of crude oil (WTI) rose nearly 6% over the week to $110. 

WTI Crude Oil price and US strategic reserves
Fonte
www.zerohedge.com, Bloomberg