Flash

Monthly market review: April showers

Martedì, 05/03/2022

After a dismal first quarter of the year, the month of April only saw equity markets volatility increase / continue and proved to be the worst month for a bond/stock portfolio in over two decades. Here are 10 stories to remember from an eventful month.

Martedì 03/05/2022 - 15:15
Charles-Henry Monchau Chief Investment officer

Story #1 - Shifting conditions

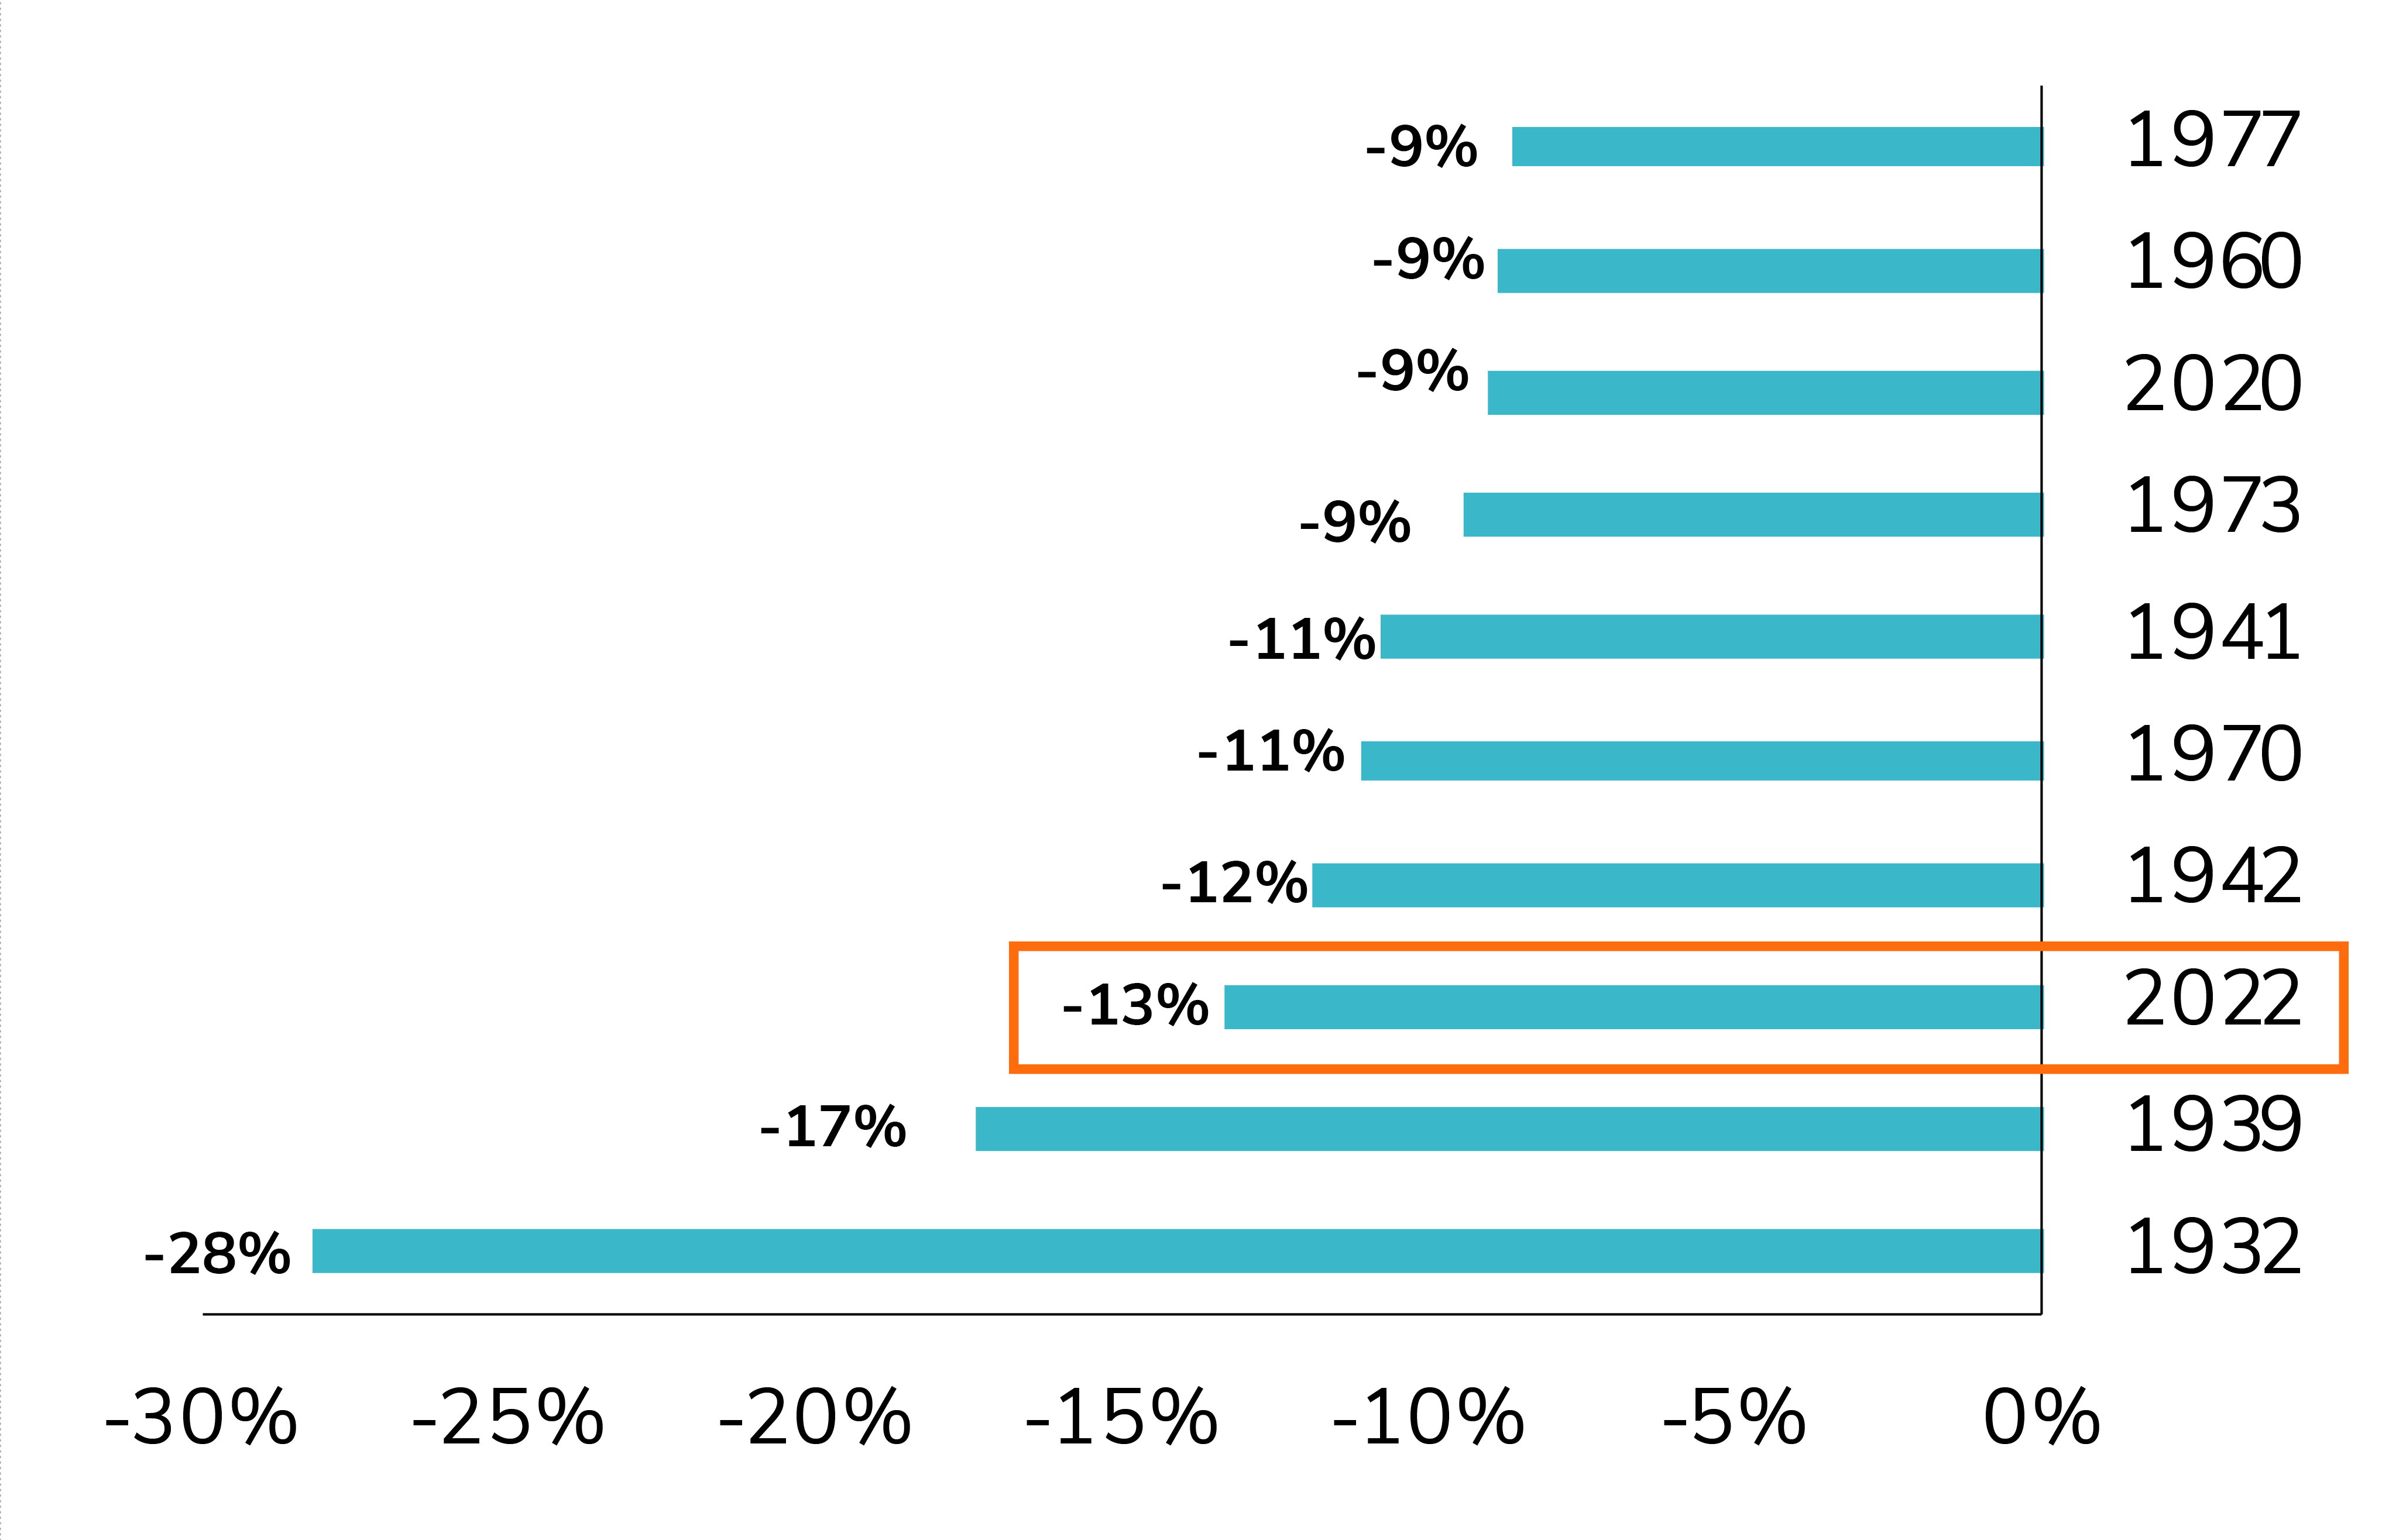
The month of April was a difficult one for risk assets. At the time of our writing, the S&P 500 is down 13.3% year-to-date, its 3rd worst start in history, after 1932 and 1939. Equity markets are currently facing several headwinds:

1. Slowing economic growth: Following a strong rebound in 2021, the global economy is entering a pronounced slowdown amid less favorable conditions with inflation rising, major geopolitical concerns and China’s harsh covid lockdowns; 

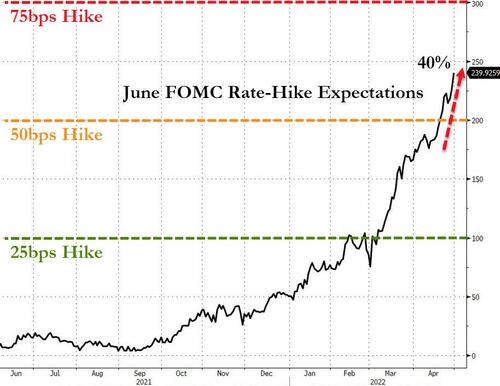
2. For the first time since more than a decade, central banks are not investor-friendly anymore. The Fed and other central banks have been too slow to tackle inflation and thus need to normalize monetary policy quickly. The hawkish rhetoric and the ensuing increase in bond yields are weighing on equity valuations;

3. Poor visibility on Russia’s war in Ukraine. The longer the war lasts, the longer the sanctions will be in place with negative consequences on commodity supplies and thus further increase risks for inflation.

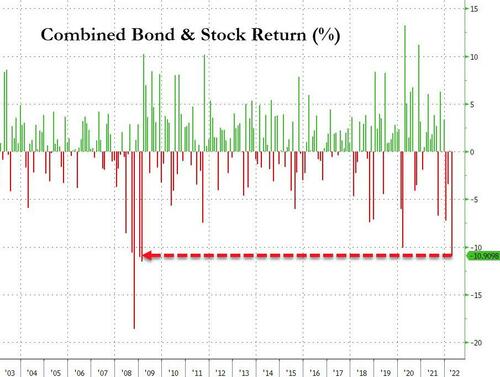
While there are some shock absorbers (healthy consumer & corporate balance sheet, rising earnings, etc.), the market context is definitely less supportive than it has been over the last two years. After a relief rally during the last two weeks of March, the vast majority of equity and bond markets recorded a spike in volatility and negative returns in April.

Stocks need to climb a wall of worry as conditions have shifted
Fonte
Edward Jones, Factset

Story #2 - Stagflation fears remain

April macroeconomic data in the US were mixed. US GDP unexpectedly shrank by 1.4% in Q1 2022. The main detractors were the trade deficit and slower government spending. However, the negative headline number masked some underlying strength in the US economy. Indeed, personal consumption accelerated slightly to 2.7% from 2.5% prior, driven by spending on services. This is above the average growth level of the last decade. Business investments increased by 9.2%, the most in a year as companies are picking up the pace of capital expenditures amid ongoing labor shortages. US inflation numbers published in April showed stubbornly high inflation albeit slightly lower than expected. For instance, the PCE Price Index showed an increase in the US inflation rate for the 16th consecutive month (to 6.6%), its highest level since 1982. It was nevertheless lower than consensus expectations.

In the Eurozone, the economy grew 0.2% in Q1. Meanwhile, inflation pressure continued to intensify in Germany. For instance, the PPI jumped by 30.9% in March YoY, the highest increase since tracking this statistic began in 1949 as price increases following the war in Ukraine are now taking full effect. Energy prices as a whole were up 83.8% YoY. The EU is currently discussing the option of a full (but phased) embargo on Russian oil, a decision which could push oil prices (and thus inflation) even higher. China’s zero covid lockdown policy is likely to further impact the global supply chain (see story #10).

Story #3 - Earnings season: the good, the bad and the ugly

At the time of our writing, the US earnings season is still ongoing. The good news is that more than half of companies are beating their sales & EPS forecasts, which is in-line with last quarter’s trends. The bad news, however, is that the guidance in April is likely to be the weakest since February 2020. The ugly news is that companies which have been guiding downward have been punished hard by the market.

One of the factors behind lower guidance is the strong dollar effect. As a reminder, it is historically very hard for US corporate profits to grow when the dollar is strong – see below.

Stocks need to climb a wall of worry as conditions have shifted
Fonte
FRED

Story #4 - Yield surge as Fed rate hike expectations are revised upwards

On the back of rising inflation, the market has been repricing the number of Fed rate hikes that should take place in the foreseeable future. More than ten 25bp Fed hike moves are now priced in for 2022 as markets see Fed Fund rate of 2.9% by December 2022. A 50bps hike seems likely   for this week's FOMC meeting and interest rates futures contracts are now pricing a near 50% chance of a 75 basis points hike in June. Meanwhile, the Fed balance sheet has shrunk in the last 2 weeks in April 2022, which seems to indicate that the Fed deleveraging has started.

Markets expectations for May FOMC meeting
Fonte
Bloomberg

In Europe, the market is now anticipating almost a 90 bps increase by year-end while QE by the ECB is expected to end in July.

The prospect of tighter monetary policy saw another month of declines for bonds. In the US, Treasuries (-3.2%) lost ground for a 5th consecutive month. The 10 year yield soared 54 basis points and the 2 year – 10 year curve steepened by +21 basis points over the month to move out of inversion territory.

EU sovereigns (-3.7%) recorded their worst ever monthly performance since 1999. Peripheral European debt underperformed, and the gap between Italian 10 year yields over bunds widened by +34bps to 184bps, the most since June 2020. 

Credit had another poor month, with every sub-index moving lower in April. US credit led the moves lower with worst performer being US Investment Grade non-financials, which is now down -13.5% on a year-to-date basis. Emerging markets bonds also suffered with a monthly loss of nearly -5%.

Story #5 - US equity markets tumbled as volatility spiked

The stock market’s relative calm in the last half of March and early April was fleeting, as the last two weeks of the month produced a near 50% jump in the Cboe Volatility Index also known as the VIX. The major US equity indices were all down for the month. The S&P 500 lost nearly 9% - its worst month since March 2020 during the Covid-19 crash. On a year-to-date basis, the S&P 500 is down -13.3%, its 3rd worst start of a year ever (see chart below).

Among the main US equity indices, the Nasdaq Composite index sustained the biggest decline at more than 13% its worst month since October 2008 amid broad weakness for technology stocks. The Tech-heavy index is now in bear market territory with a 24% decline from November 2021 peak. One of the biggest losers were the mega cap tech stocks as the FANG+ index shed 18.9% over the month, its worst performance since the index launched.

The worst start to a year for the S&P 500 index
Fonte
Bloomberg

Story #6 - Mixed sector leadership. Rest of the world outperformed US equities

From a sector standpoint, S&P Consumer Staples was the only sector to end the month in the green (+2.9%) with Technology and Consumer Discretionary losing over 10%. Financials loss were almost as bad despite the rise of bond yields and the steepening of the curve. They lost 9%. Energy declined slightly (-1.8%) and remains the best performing equity sector on a year-to-date.

From a country perspective, other developed markets outperformed the US this month. Europe witnessed a small loss (-1.2% for the STOXX 600 in local currencies). The Nikkei 225 was down -3.5% while the Hang Seng index lost 4.1% (all in local currencies). Emerging markets were down 5% over the month.

Story #7 - Equity fund flows turn negative while sentiment is overly bearish

One of the surprising stories of the 1st quarter was the strong inflows into equity funds despite the negative headlines (war, inflation, monetary tightening, etc.). A plausible explanation was that investors were looking for shelter from the rise of inflation. But in a stark contrast from the first three months of 2022, equity funds suffered outflows in April for three straight weeks, the longest streak of withdrawals since August 2020, data compiled by EPFR Global show (see chart below).

We also note that market sentiment turned bearish during April – which is often seen as a positive signal from a contrarian perspective. Indeed, the AAII Bull-to-Bear ratio has almost never been this low and traders are very much hedged against more downside. Put volumes are even more extreme relative to call volumes than at the start of the last surge in late March. These create the conditions for a short squeeze.

Rolling 3-week equity fund flows
Fonte
Bloomberg

Story #8 - Double-whammy effect for multi-assets. Commodities the only bright spot

What happened in April has only been seen three other times since data started in 1973: a month where S&P 500 returns fall more than 5% and US Treasuries fall more than 2%. April was actually the worst month for a bond/ stock portfolio since February 2009. There were indeed not many places to hide. The bright spot was, once again, commodities. Brent and WTI Crude Oil (+4.4%) moved higher for a 5th consecutive month as speculation continues about a potential EU embargo on Russian oil. However, the upside was capped due to coronavirus lockdowns in China (see story #10). Bloomberg’s Agriculture Spot Index (+4.9%) rose for a 9th consecutive month in April, which will be bad news for consumers, especially those in emerging markets, given the strong rise in food prices we’ve already seen. The individual gains included corn (+9.3%), which now has a year-to-date gain of 37.9%.

April was the worst month for bond/stock portfolio since 2/2009

Story #9 -The King dollar

The greenback built on its Q1 gains to move 4.7% higher in April, which also marked its best month since January 2015. It is now the top-performing G10 currency on both a monthly and year-to-date basis. The dollar is trading at its highest level since March 2020, amid a diminished outlook for the global economy and policy tightening by the U.S. Federal Reserve.

By contrast, the Japanese Yen weakened against the dollar in April (-6.2%), as the Bank of Japan’s continueddovishness sets it apart from the other major central banks. While there were some rumors of interventions, the BoJ remains committed to yield curve control which means that further weakness lies ahead. The Japanese Yen is at its lowest level since 2002 (vs. US Dollar), down 42% from its high in 2011.

Japanese Yen versus. US dollar
Fonte
Charlie Bilello

The strong U.S dollar has some important implications:

1. A negative impact on US earnings because:

    a. Importing US made goods from other countries becomes more expensive and declines

    b. Revenues from foreign subsidiaries, valued in dollars, are lower by definition

2. Higher exported inflation to the rest of the world (as commodities are priced in $)

3. Higher debt costs for non-dollar based, dollar borrowers

4. Financial risks, e.g de-peg risk in Hong-Kong, in the Middle East, etc.

Story #10 - China covid lockdowns

China is facing its worst Covid-19 outbreak since the peak of the first wave in early 2020. Their zero-covid policy led them to impose strict lockdowns in a large number of cities. These lockdowns are weighing heavily on Chinese economic activity, impacting both supply and demand. The official manufacturing PMI came out at 47.4 vs. 49.5 in March.

This is the lowest level since February 2020. Meanwhile, the Caixin private survey exhibited the steepest drop in 26 months. As lockdowns are expected to last at least until mid-May, China Q2 GDP is likely to be heavily impacted. This also means that it will be difficult for China to reach the 5.5% real GDP growth target which has been set for the full 2022.

The China lockdowns are also likely to impact global growth as they impact not only factory activity but also logistics with many trucks currently in a standstill while ships are queuing outside Shanghai. Global supply chains are thus likely to be impacted, creating further upside risks to inflation and downside risks to growth.

The market is expecting some help from monetary policy but the response so far has been muted. First because interest rate cuts and big liquidity injections are likely to be ineffective. Second because the Politburo might fear that a major stimulus plan (equivalent to the $600B liquidity injection which took place in 2008/2009) could create major capital outflows, leading to more downside pressure on the yuan. The Politburo recently announced big infrastructure spending plans but they will take time to implement.